There are additional costs and challenges associated with private finance procurement
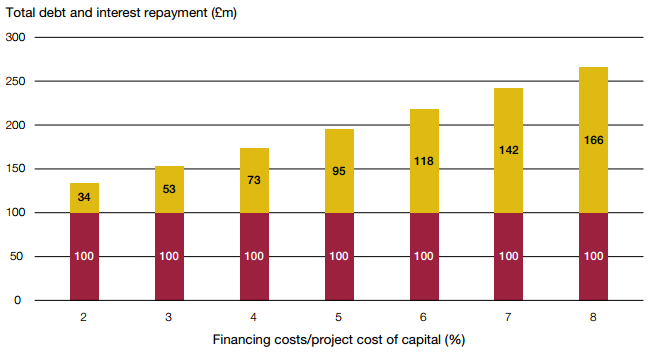
1.17 Private finance procurement results in additional costs compared to publicly financed procurement, the most visible being the higher cost of finance. The 2010 National Infrastructure Plan estimated an indicative cost of capital for PFI as 2% to 3.75% above the cost of government gilts.18 Data collected by IPA on PFI and PF2 deals entered into since 2013 show that debt and equity investors are forecast to receive a return of between 2% and 4% above government borrowing.19 However, some 2013 deals, agreed when credit market conditions were poor, projected an annual return for debt and equity investors of over 8%; this was more than 5% higher than the cost of government borrowing at the time.20 Small changes to the cost of capital can have a significant impact on costs - as an illustration: paying off a debt of £100 million over 30 years with interest of 2% costs £34 million in interest; at 4% this more than doubles to £73 million (Figure 3).
Figure 3 Illustrative total cash cost of repaying a 30-year loan in equal annual instalments |
Small changes to the cost of capital can have a significant impact on the cost of repaying a loan
 Capital repayment
 Interest
Source: National Audit Office analysis |
1.18 There are other areas where the private finance model can result in additional costs and also ways in which it differs to the approach HM Treasury would usually recommend. These include:
• Insurance
HM Treasury recommends that the public sector self-insures as it considers the government is best placed to pool these risks but the PFI/PF2 model requires the SPV to take out buildings and business interruption insurance.
• Cash management
The PFI structure means that SPVs hold surplus cash to meet the requirements of lenders. HM Treasury normally discourages holding any excess cash in commercial accounts. We estimate that they hold more than £4 billion collectively.21 Interest paid on these balances will be factored into the unitary charges paid by the public sector.
• Costs of external advisers
The complex nature of private finance procurement means there is a greater need for both the public sector and potential bidders to use advisers.
• Fees to lenders
Arrangement fees are typically about 1% of the amount lent but can be as high as 2%. In some cases fees are also paid to credit rating agencies.
• SPV management and administration fees
With a PFI/PF2 deal, there are costs associated with the SPV, such as company management and production and auditing of accounts. These amount to around 1% to 2% of the total PFI payment.
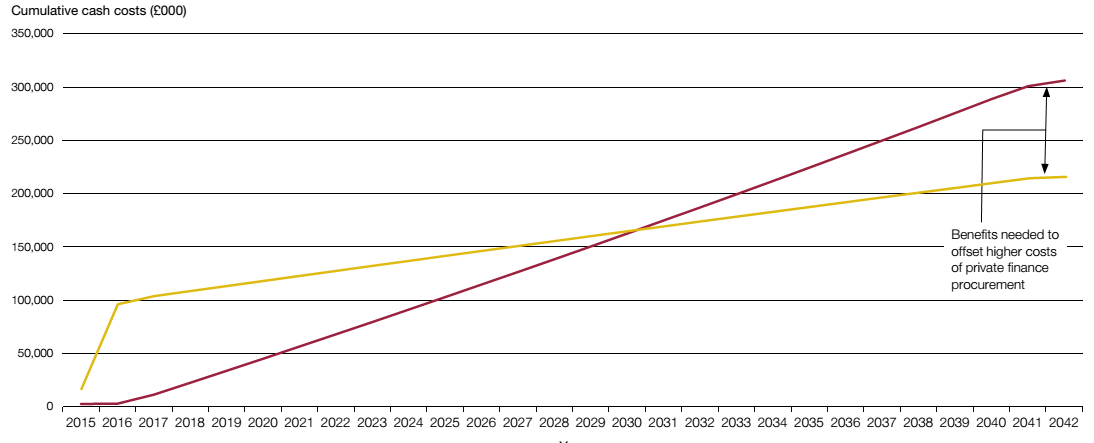
1.19 The higher cost of finance, combined with these other costs, means that overall cash spending on PFI and PF2 projects is higher than publicly financed alternatives. The Department for Education has estimated the expected spend on PF2 schools compared with a public sector comparator (PSC). Our analysis of these data for one group of schools shows that PF2 costs are around forty per cent higher than the costs of a project financed by government borrowing (Figure 4 overleaf). The Treasury Committee undertook a similar analysis in 2011, which estimated the cost of a privately financed hospital to be 70% higher than the PSC.22
Figure 4 Estimated cash flows of a privately and publicly financed project |
The cumulative cash costs of a group of PF2 schools are around forty per cent higher than the costs of a project financed by government borrowing
 PF2 unitary charges
 Public sector comparator (PSC) with government borrowing costs
Notes
1 Cost estimates taken from data prepared by the Department for Education to compare costs of a group of privately financed (PF2) schools with a public sector comparator (PSC).
2 Interest costs for the PSC have been modelled using an amortising loan with an interest rate of 2.5%. The 20-year government borrowing costs were 2.5% at the time of financial close of this project and the average life of the project debt was less than 20 years.
Source: Education Funding Agency; National Audit Office analysis |
___________________________________________________________________________________________
18 HM Treasury, National Infrastructure Plan 2010, October 2010, Table A.1, page 45.
19 These returns are the base case project IRR (Internal Rate of Return) after tax estimated at the time of financial close.
20 Four social housing PFI deals in 2013 recorded returns of more than 8% for debt and equity investors in the financial close forms provided to HM Treasury.
21 National Audit Office analysis of a sample of SPV companies.
22 See footnote 6.