Departments have significant outstanding PFI commitments
2.4 Despite the reduced use of PFI and PF2 for new investment, the legacy of deals have a long-lasting impact. The public sector will still be making PFI unitary charge payments to private finance companies in the 2040s. Future payments for existing projects are forecast to total £199 billion from 2017-18 onwards - an average of £7.7 billion a year over the next 25 years (Figure 7 on page 25). In 2016-17, total payments amounted to £10.3 billion, of which 59% related to four departments (Health and Social Care; Defence; Education and Transport). These payments cover financing costs (debt and interest payments and a return to shareholders) and operational costs. Public bodies also have to pay for maintenance and operational costs of publicly financed buildings.
Figure 6 Capital value and the number of PFI deals over time |
Private Finance Initiative (PFI) capital investment peaked in 2007/08 at £8.6 billion and has been on a downward trend since
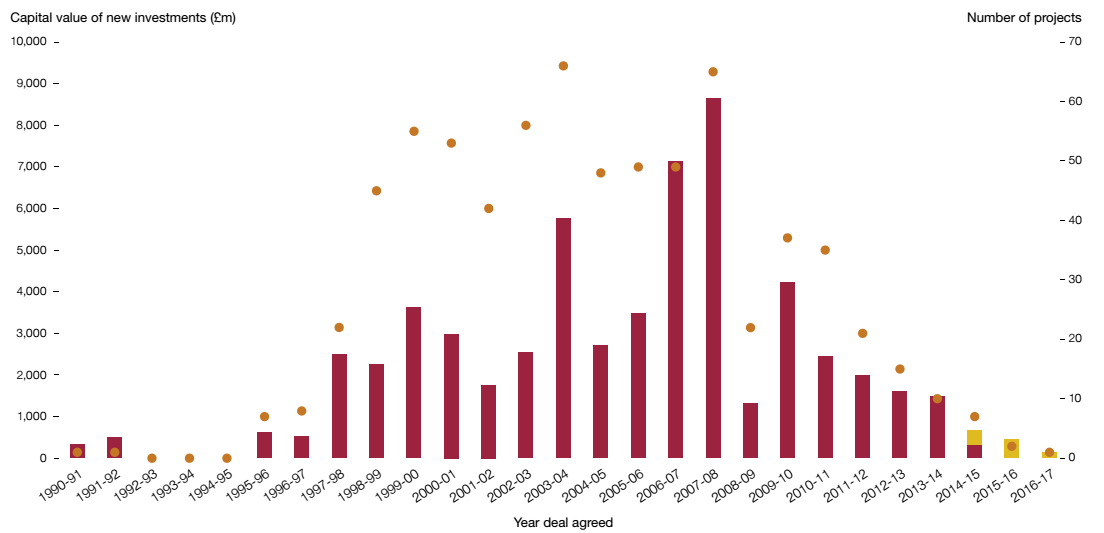
 Capital value of PFI deals
 Capital value of PF2 deals
 Number of PFI and PF2 projects that reached financial close each year
Notes
1 These data do not include data for projects initially procured as PFI projects but which were terminated (eg TfL Metronet, Channel Tunnel Rail Link).
2 The Private Finance 2 (PF2) model was launched in 2012.
Source: HM Treasury's 2016 PFI database; InfraDeals; National Audit Office analysis |
Figure 7 PFI past and forecast unitary charge payments |
Departments have outstanding Private Finance Initiative (PFI) commitments of £199 billion
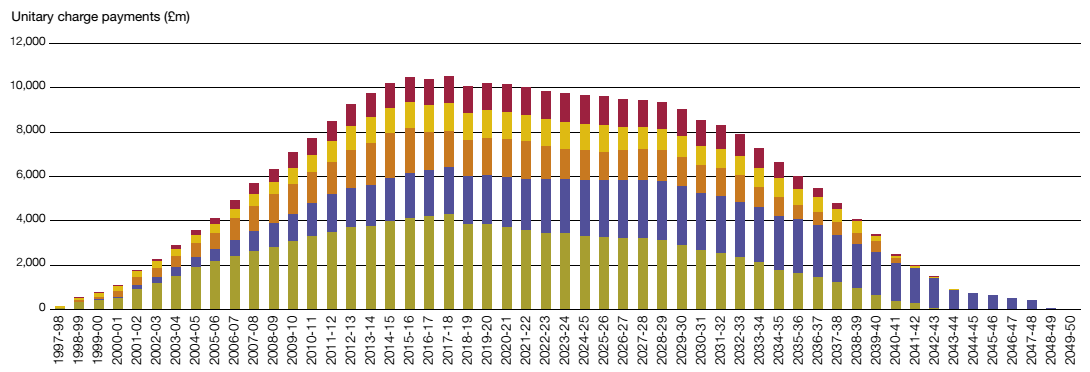
Department for Education
 Department for Transport
Ministry of Defence
 Department of Health
 Other
Other
Source: HM Treasury database |
2.5 The most recent figures available from HM Treasury show that the health sector has used PFI for more capital investment than any other department (£13 billion) (Figure 8). Health bodies made total unitary charge payments of £2 billion in 2016-17, 1.7% of the total cash budget for the Department of Health and Social Care. This figure masks a significant variation between health trusts-some have no PFI deals whereas those providers that do have PFI deals have unitary charges which vary between 5.6% and 20.1% of turnover.40
2.6 Data used in the Whole of Government Accounts (WGA) records that around half of current annual PFI charges relate to debt repayment and financing costs (interest and dividends). The balance is service charges - the costs of operating and maintaining the asset. The exact split of debt repayment, financing and service charges will vary over time, as debt is repaid, and from project to project.41 The service element of PFI payments increases each year in line with a retail price index (RPI) inflation measure.42 In the case of some health deals, the whole payment, not just the service charge, rises with inflation.43 Between 2000-01 and 2009-10 departmental budgets increased above RPI inflation. However, for the past seven years, overall departmental budgets have fallen in real-terms (Figure 9).
Figure 8 Use of PFI by departmental group |
The Department of Health and Social Care has used the Private Finance Initiative (PFI) to generate £13 billion of capital investment - more than any other department
Departmental Group | Capital value of initial investment (£bn) | Number of projects | Unitary charge in 2016-17 (£bn) | Departmental cash budget in 2016-17 (£bn) | Unitary charge as a percentage of cash budget |
Health and Social Care | 13.0 | 13.0 | 13.0 | 13.0 | 13.0 |
Defence | 9.5 | 41 | 1.7 | 35.2 | 4.9 |
Education | 8.6 | 172 | 1.1 | 64.9 | 1.8 |
Transport | 7.8 | 61 | 1.2 | n/a | n/a |
Other | 20.5 | 315 | 4.2 | 127.7 | 3.3 |
Total | 59.4 | 716 | 10.3 | 348.3 | 2.9 |
Notes
1 Over half of the 'transport' PFI projects are not supported by funding from the Department for Transport (DfT), so comparisons with the DfT's cash budget are not possible.
2 The figures represent data as at 31 March 2016 and do not reflect changes to PFI deals since this date.
3 Totals may not sum due to rounding.
Source: HM Treasury database |
Figure 9 Total annual government resource budget increase compared to RPI increases1 |
Over the past seven years the total government resource budget has fallen in real terms
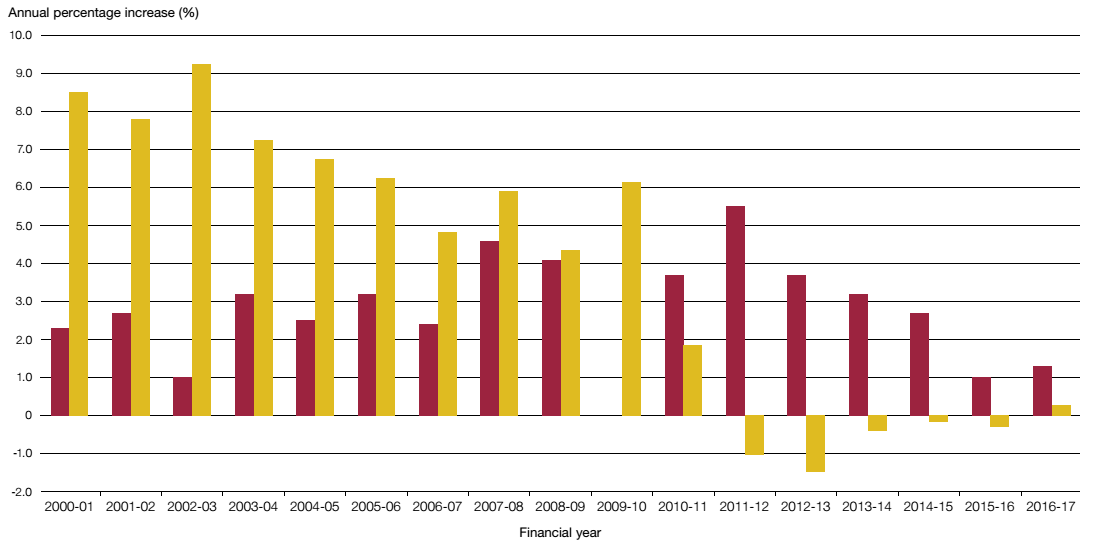
Annual RPI increase Annual Resource Departmental Expenditure Limit (DEL) increase
Notes
1 The Retail Price Index (RPI) is a measure of inflation looking at the change in the cost of a representative sample of retail goods and services.
2 The government budget that is allocated to and spent by government departments is known as the Departmental Expenditure Limit (DEL). DEL is spent on running public services, such as schools and hospitals, and paying the everyday cost of resources such as staff.
3 RPI inflation was zero in 2009-10.
Source: National Audit Office analysis; HM Treasury's Public Expenditure Statistical Analyses (PESA) data |
___________________________________________________________________________________________
40 Comptroller and Auditor General, Department of Health, Achievement of foundation trust payments by NHS hospital trusts, Session 2010-2012, HC 1516, National Audit Office, October 2011, paragraph 2.14.
41 For example the majority of the charge for prison PFI deals, which include outsourcing of prison staff, relates to services. On the other hand the charges for PFI schools are primarily made up of debt and finance costs.
42 An RPI or RPIX (which exclude housing costs) index is used.
43 Some hospital PFI deals were financed with inflation linked debt so the financing element also increases with inflation.