Changes under PF2
3.5 In December 2012, 12 months after the consultation process had started, HM Treasury launched Private Finance 2 (PF2) as the successor to PFI. There have been a number of changes (Figure 14 on page 38), however the fundamental characteristics of PFI remain unchanged in the PF2 model: the private sector finances, builds and maintains an asset and the public sector pays an annual fee for 25 to 30 years. Before the launch of PF2 there had been four iterations to the standard PFI contract. The first PF2 projects which progressed were PF2 schools - the contract and project documents used for these deals are slightly altered versions of PFI documents, demonstrating the limited changes between PFI and PF2.
3.6 One of the key changes announced in HM Treasury's PF2 launch document was not implemented. Higher levels of equity (20% to 25%) and lower levels of debt were originally planned in order to make PF2 debt lower risk, thereby encouraging investors such as pension funds to invest in PFI debt and reducing debt costs. As at September 2017, there were six PF2 projects - five education and one health. All of these projects are financed with equity levels in the region of 10% and debt in the region of 90% - the same financial structure as PFI deals. No pension funds or other new investors have invested in PF2 debt, although a number of pension funds bid in the debt funding competition for the Midland Metropolitan Hospital PF2 deal. HM Treasury and Infrastructure and Projects Authority (IPA) told us that the need for lower levels of debt became unnecessary as the lending market improved.
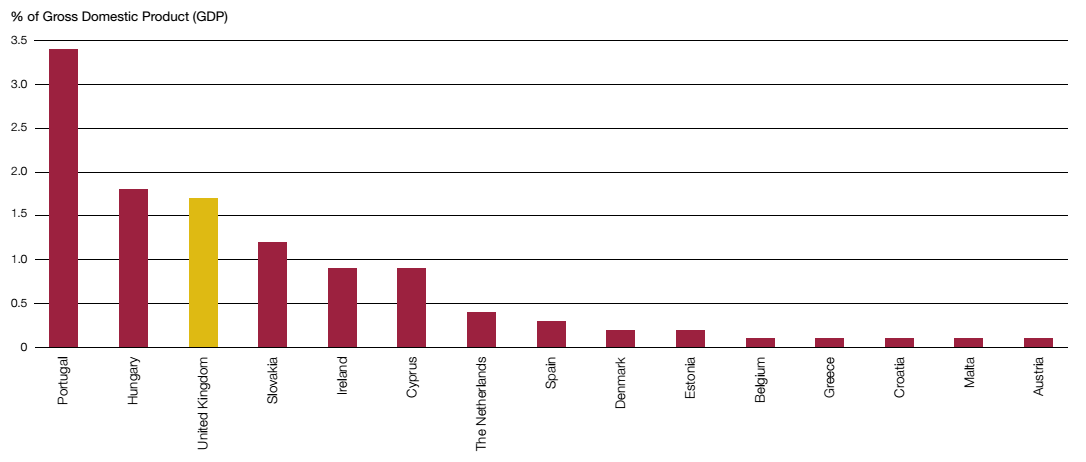
Figure 13 Liabilities related to off-balance sheet Public Private Partnerships (PPPs) across Europe |
The UK has the third highest number of off-balance sheet PPP projects across Europe1
Note
1 The following countries spend 0% of GDP on PPPs: Bulgaria, Czech Republic, Germany, France, Italy, Latvia, Lithuania, Luxembourg, Poland, Romania, Slovenia, Finland and Sweden.
Source: Eurostat, Government Finance Statistics: What is the extent of contingent liabilities and non-performing loans in the EU Member States?, 30 January 2017 |
Figure 14 Comparison between Private Finance Initiative (PFI), Private Finance 2 (PF2) as per the HM Treasury launch document and PF2 in its current form |
| Original PF2 | Current PF2 | |
No or limited change |
|
|
|
Finance structure | 90% debt, 10% equity | 75% debt, 25% equity | 90% debt, 10% equity |
Contract length | 25 to 30 years | 25 to 30 years | 25 to 30 years |
Balance sheet treatment (National Accounts) | Off-balance sheet | Off-balance sheet | Off-balance sheet |
Budgetary treatment of PFI capital investment | Upfront capital costs not included in departmental budgets | Upfront capital costs not included in departmental budgets | Upfront capital costs not included in departmental budgets |
Restrictions on equity returns or sales | No | No | No |
Soft services (such as cleaning and catering) | Included in early PFI deals but not in recent deals | Usually exclude (but option to include) | Usually exclude (but option to include) |
Key changes |
|
|
|
Public sector equity | Not required | Required | Required |
Publication of equity returns | No | Yes | Yes |
Equity funding competitions | No | Encouraged/optional | Encouraged/optional |
Public sector keeps risk of: Change in law, utilities costs, site contamination | No | Yes | Yes |
Limited tendering phase | No | 18 months maximum | 18 months maximum |
Changes introduced/reversed to ensure PF2 remains an off-balance sheet vehicle | |||
Lifecycle fund gain-share | No | Yes | No |
Refinancing gain-share | At least 50% | At least 50% | No more than 30% |
Source: National Audit Office analysis of HM Treasury documents |
3.7 Another change was the introduction of a control total in order to limit off-balance sheet commitments arising from PFI and PF2 deals. The control total covers all existing PFI and PF2 contracts sponsored by central government, and includes all payments made under these contracts, such as debt, interest and future service costs. The control total limits PFI/PF2 commitments to £70 billion, in nominal terms, across the five-year period from 2015-16. HM Treasury first reported on the progress against this target in Budget 2016. It reported that forecast cumulative PFI/PF2 spending from 2015-16 to 2019-20 was £51.7 billion, therefore leaving significant headroom for further investment. The Treasury Committee has previously been critical of this control total, reporting that it fails to remove the budgetary incentives to use PFI over conventional government procurement, at least until the £70 billion cap has been reached.
3.8 Some of the changes introduced in PF2 could be, and were, pursued under PFI and did not require any change to the contract. For example, PF2 usually removes services, such as cleaning and catering, from most new contracts in order to improve flexibility and reduce costs. However, many PFI deals already excluded soft services: only one of six NHS PFI schemes being procured in the period just before PF2's launch included these services. Also the decision to limit the tendering process to 18 months, unless the Chief Secretary to the Treasury agrees otherwise, could have been implemented under PFI.
3.9 However there were some changes that required amendments to the standard contract. The most significant was the introduction of public sector equity and the requirement to publish more information on equity returns. This is outlined below.