Financial performance up to July 2017
77. Until July 2017, there was little public information to suggest that Carillion's accounts, which were signed off with an unmodified opinion each year by KPMG as auditor, presented anything other than a true and fair picture of the company's finances. They showed a profitable company. After a sustained fall following the financial crisis in 2008, revenue had grown strongly. Earnings per share had also increased steadily since 2014. Carillion's profit margins, while unspectacular at around 5-6%, were still "attractive relative to peers".270
Figure 3: Carillion's total revenue
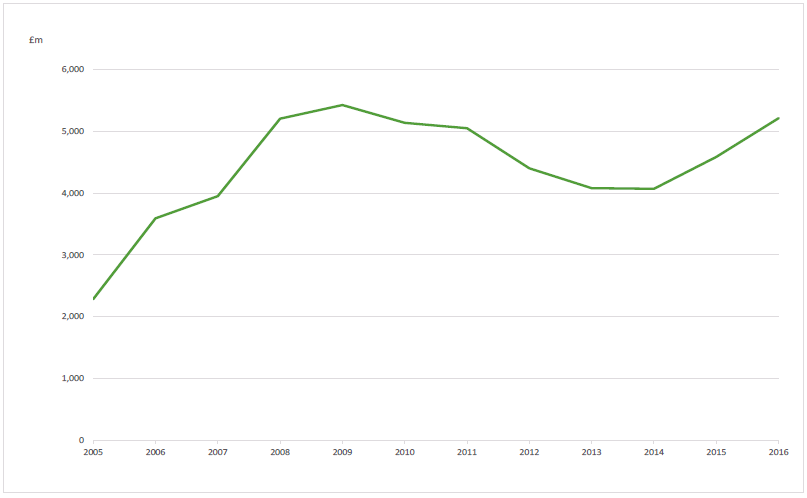
Source: Carillion plc Annual Report and Accounts 2005-2016
78. There were, however, indicators of underlying problems. Most notably, borrowing had increased rapidly, from £242 million in December 2009 to £689 million in December 2016.271 This contributed to a big spike in the company's debt to equity ratio, which reached 5.3 by December 2016, considerably above the ratio of 2 widely considered acceptable.272 The company also had a low level of working capital: its ratio of current assets to current liabilities remained static at around 1.0 between 2013 and 2016. Anything lower than 1.2 is potentially indicative of a company in financial difficulty.273
Figure 4: Carllion's working capital ratio
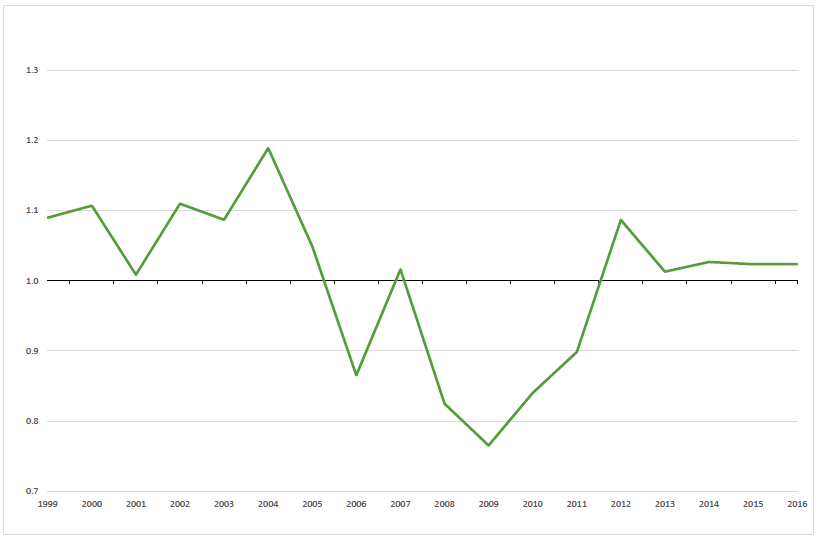
Source: Analysis of Carillion plc's Annual Report and Accounts 1999-2016
____________________________________________________________________
270 Q1026 [Murdo Murchinson]
271 The collapse of Carillion, Briefing Paper 8206, House of Commons Library, March 2018
272 Investopedia, What is considered a good net debt-to-equity ratio?, accessed 27 April 2018
273 Investopedia, What does a low working capital ratio show about a company's working capital management, accessed 27 April 2018