5.1 PPP Lending Portfolio
During the period under review (2006 - 2016), the Bank's PPP portfolio consisted initially of 39 projects, totaling USD 2.4 billion. These projects were designated as projects undertaken on PPP mode by the Bank's operations departments. However, further analysis carried out by IDEV, as part of the stocktaking exercise, concluded that only a total of 33 projects representing a total financing from the Bank of UA 1.45 billion (USD 1,8 billion) could be identified as being PPP-structured operations, with contractual obligations between the public and private parties for the provision of infrastructure services. The final PPP portfolio for the review period validated by OSPD stands at 32 projects (see Annex 3 of Volume 2 of the Inception Report).
The composition of the PPP operations financed by the Bank over the 2006-2016 period and validated by OPSD (32 projects) used the criteria defined in Table 2 below.
Table 2: Composition of PPP Portfolio using the defined criteria
| Defined Criteria for PPP projects | No. PPP Projects |
| Infrastructure Service Delivery By: |
|
| - Public Companies | - |
| - Private Companies | 32 |
| Type of PPP Arrangements: |
|
| - BOOT/DBOOT (Including PPA) | 17 |
| - BOO (including PPA) | 12 |
| - Concession Agreement | 3 |
| Tenure: |
|
| - 20 years | 9 |
| - 25 years | 6 |
| - 30 years | 5 |
| - 35 years | 2 |
| - 40 years | 1 |
| - Not Specified | 9 |
| Risk Sharing Arrangements33: |
|
| - Government Support under Implementation agreement or Support Letter of Agreement Support for payment default | 13 |
| - Interconnection to National Grid Agreement | 6 |
| - Viability financing support, Foreign exchange risk guarantees, tariff adjustments, Price indexation mechanisms, revenue guarantees | 7 |
| - Fuel/gas supply | 2 |
| - Investment protection, investment promotion agreement | 1 |
| - Not specified | 9 |
The majority of the PPP projects are run by private companies (or with minimal public shareholders). The tenure in 20 years and above showing the long-term cooperation and partnership. The risk sharing arrangements are well specified (at least for 23 PPP projects) in a concession agreement or in an implementation arrangement with the government whereby government's obligations are well specified in terms of support in case of payment default, tariff adjustments, price indexation and revenue guarantees or in fuel or gas continuous supply. The government's responsibility in investment protection and investment promotion was also specified but only for one PPP project.
Out of these 32 PPP projects, three (3) have been financed under the public sector window of the Bank, while the private sector window financed the lion share of 29 projects. The three (3) projects financed by the public sector window of the Bank fall under the Energy sector department (ONEC), and amount to UA 404.7 million in total net commitments. These three (3) PPP projects represent 9.4% and 27.7% of the number of PPP projects and the Bank's total net commitment to PPP projects, respectively. The public sector window financing of PPP projects was in the Power sector in two countries, namely Morocco and Zambia comprising two solar energy projects in Morocco (Parc Éolien de Tanger and Complexe Solaire de Ouarzazate) for a total amount of UA 314.4million and a power transmission project in Zambia for a total amount of UA 90.2million.
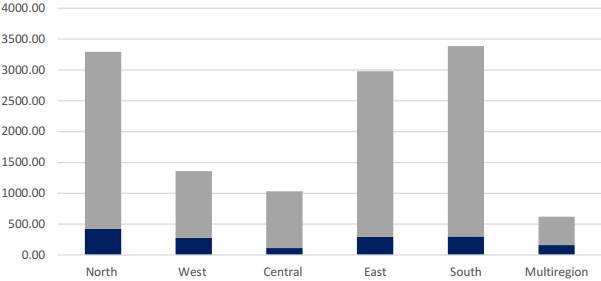
Table 3: Bank Total Net Commitment to Infrastructure Projects by Region 2006-2016 (in UA Million)
| Region | Total | Bank net commitment (in percentage of Bank total net commitment) | Total | |||
|
| NON-PPP |
| NON-PPP |
| ||
| North | 422,43 | 2871,99 | 3294,42 | 13% | 87% | 100% |
| West | 278,37 | 1082,55 | 1360,92 | 20% | 80% | 100% |
| Central | 112,61 | 920,39 | 1033,00 | 11% | 89% | 100% |
| East | 294,81 | 2683,67 | 2978,48 | 10% | 90% | 100% |
| South | 298,77 | 3090,52 | 3389,29 | 9% | 91% | 100% |
| Multi-regional | 161,25 | 459,11 | 620,36 | 26% | 74% | 100% |
| Total | 1568,24 | 11108,23 | 12676,47 | 12% | 88% | 100% |
Source: IDEV (SAP Data)
The 29 projects financed by the private sector window (OPSD) of the Bank amounted to a UA 1.053 Billion and were concentrated in the Power and Transport sectors with sixteen (16) and ten (10) projects, respectively. The two (2) latter sectors represent a total of 89.6% of the number of private sector window PPP project financing, and 95.4% of the total net commitment to private sector-financed PPP projects. Of the sixteen (16) power sector PPP projects financed by the private sector window of the Bank, ten (10) are electricity projects. The total financing for these ten (10) electricity PPP projects amounts to UA268.5 Million, which represents 48% of the Bank's net commitment to the Power sector PPP projects. Clean energy, with three (3) projects only represents 18% of this sub-portfolio in terms of commitments. As far as the transport sector is concerned, the ten (10) PPP projects financed by OPSD amounted to UA 446.7 Million, representing 42.4% of the total private sector window financing of PPP projects.
The Bank commitments for these PPP projects represent 12% of the total commitments during the period. This percentage varies across the region as shown in Table 3 and figure 3 below with a concentration in the North region representing 27% of the total PPP commitments during the period.
Figure 3: Regional Distribution of the Bank's Total Net Commitments 2006-2016 (in UA Million)
|
| |
| ■ PPP projects | ■ NON-PPP projects |
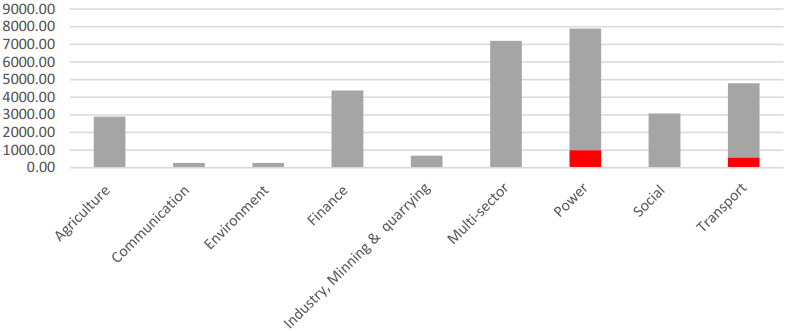
The distribution of Bank Net Commitments by sector (PPP and Non-PPP) is shown in the following figure 4.
Figure 4: Sectoral Distibution of Bank Net Commitments 2006-2016 (in UA Million)
|
| |
| ■ PPP projects | ■ NON-PPP projects |
| Source: IDEV (SAP data) | |
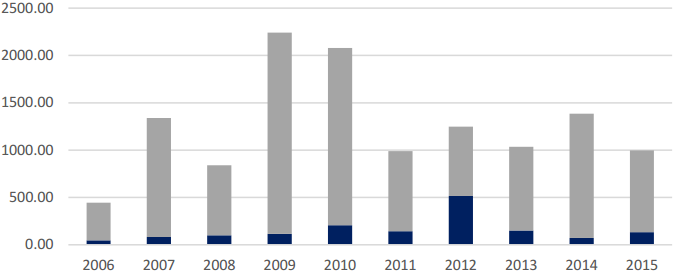
On a yearly basis (Figure 4), the total Bank commitments for PPP and Non-PPPs were unequally distributed across the years with an average of UA 142 million per year for PPPs which took shape in 2012 (33% of the total commitments for the year). The very low volume of PPP projects on an annual basis relative to the Bank's total of projects annually seems to require a concerted effort to boost PPP infrastructure project development and financing and help to close the infrastructure gap in Africa as committed through the High Fives and the Ten-Year Strategy.
Figure 5: Bank Total Yearly Net Commitment (in Million UA) 2006-2015
|
| |
| ■ PPP projects | ■ NON-PPP projects |
| Source: IDEV (SAP data) | |
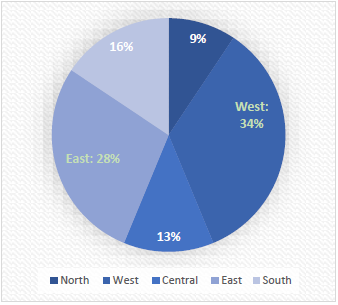
The Bank' s PPP portfolio in terms of number of projects is concentrated in the West and the East part of Africa (62%), while in terms of commitment amounts, the Bank's PPP portfolio is concentrated in the North and South (52%) as shown in Table 4 and Figures 6 below.
Table 4: List of PPP portfolio distributed by region 2006-2016
|
| Countries | Number of | % | Net commitment | % | Sectors |
| North | Morocco | 2 |
| 368,1 |
| Power |
| Tunisia | 1 |
| 54,1 |
| Transport | |
| Sub-Total | 3 | 9.4 | 422,2 | 29.0 |
| |
| West | Cape Verde | 1 |
| 11,3 |
| Power |
| Cote d'Ivoire | 3 |
| 111,9 |
| Transport, Power | |
| Ghana | 2 |
| 28,3 |
| Tourism, Power | |
| Nigeria | 1 |
| 34,9 |
| Transport | |
| Senegal | 3 |
| 70,5 |
| Transport, Power | |
| Togo | 1 |
| 33,9 |
| Transport | |
| Sub-Total | 11 | 34.4 | 290,8 | 20.0 |
| |
| Central | Cameroon | 3 |
| 88,6 |
| Power |
| Madagascar | 1 |
| 4,7 |
| Power | |
| Sub-Total | 4 | 12.5 | 93,3 | 6.4 |
| |
| East | Djibouti | 1 |
| 55,9 |
| Transport |
| Kenya | 2 |
| 134 |
| Power | |
| Multinational | 2 |
| 28,2 |
| Transport | |
| Rwanda | 1 |
| 16,6 |
| Power | |
| Seychelles | 1 |
| 5,9 |
| Communication | |
| Uganda | 2 |
| 80,4 |
| Power | |
| Sub-Total | 9 | 28.1 | 321 | 22 |
| |
| South | South Africa | 2 |
| 237,6 |
| Power, Transport |
| Zambia | 3 |
| 90,8 |
| Power, Mining | |
| Sub-Total | 5 | 15.6 | 328,4 | 22.6 |
| |
| Total |
| 32 | 100.0 | 1455,7 | 100.0 | Power (19), Transport (10), Tourism (1), Communication (1), Mining (1) |
Source: IDEV (SAP Data)
Figure 6: Regional Distribution of the Bank's PPP portfolio
(in number and commitments: 2006-2016)
|
|
|
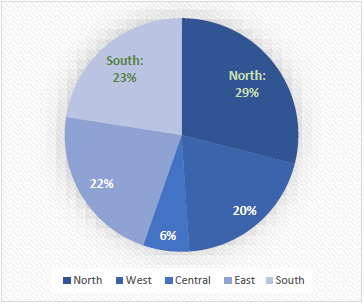
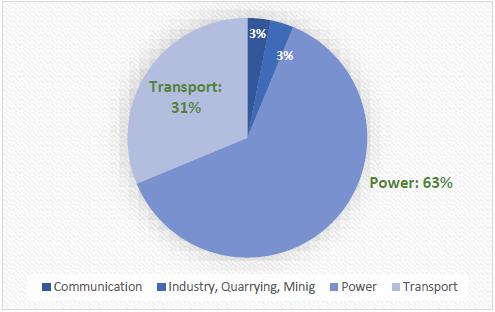
The distribution of the Bank's PPP portfolio by sector shows a strong concentration in the power sector in both volume and number. The Bank approved 20 PPP projects in the power sector for the 2006-2016 period34, totaling UA 962 million in net commitments. This represents 63% of the Banks PPP net commitments over the covered period. The transport sector follows with ten (10) PPP projects approved, totaling UA 446.7 million. One (1) Information Communication Technology (ICT) project was also approved by the Bank for a total amount of UA 5.96 million. Similarly, the Bank approved one (1) project in the industry and mining sector, totaling UA 42.4 million. See figure 8 below.
Figure 7: Distribution of PPP Portfolio by Number of Projects per Sector: 2006-2016
|
Source: IDEV (SAP data) |
Out of the 32 projects in the 2006-2016 PPP portfolio, 23 operations, representing 72% of the projects were totally disbursed , with only 6 of them having Expanded Supervision Reports (XSRs). See Annex 3 of the Volume 2 of the Inception Report (Technical Annexes). Annex 4 of the Volume 2 of the Inception Report (Technical Annexes) presents other statistical data of the Portfolio.
____________________________________________________________________________________
33 The detailed information on the PPP projects will be collected during the data collection Phase of the Evaluation (See Section 7 below)
34 Power sector PPP projects are spread throughout five sub-sectors: hydro; thermal; wind; solar and Coal/gas/oil-fired power stations with a total of 958.9 UA million. Solar power projects score highest with in total USD 385million (40%).