ASIA ACCOUNTS FOR ALMOST HALF THE GAP
A report published by ADB in March 2017 estimates that developing Asia will need to invest about $1.7 trillion per year in order to maintain a growth trajectory that sufficiently eradicates poverty.4 This is more than double that of ADB's 2009 estimate; with the inclusion of climate-related investments being a major contributing factor.† Of that annual investment spend needed, more than 60 percent is required by East Asia, followed by a quarter for South Asia, and 12 percent by Southeast Asia. This large disparity in annual investment needs is attributed to the difference in the sub-regions' economic development, growth prospects, and existing levels of infrastructure.
The $881 billion infrastructure spend by the 25 Developing Member Countries (DMCs) is well below the projected annual investment needs of $1.34 trillion over the five-year period from 2016 to 2020, resulting in an annual gap of about $460 billion.‡ Excluding China, this gap shrinks by a third to $308 billion (Exhibit 11).
EXHIBIT 11: MEETING THE INVESTMENT GAPS - SELECTED ADB DEVELOPING MEMBER COUNTRIES*1
ANNUAL AVERAGES, $ BILLIONS, 2016-2020
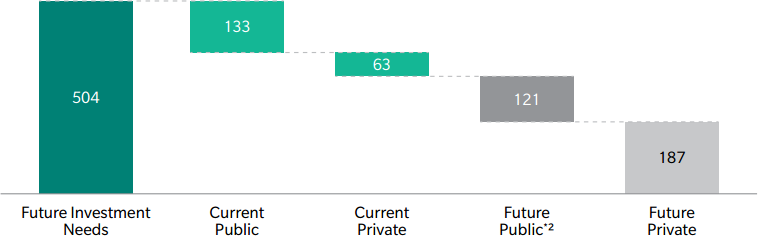
*1 Climate-adjusted estimates
*2 Future public investments are based on the 50 percent fiscal space assumption
Source: Asian Development Bank
Based on Marsh & McLennan Companies' Asia-Pacific Risk Center's (APRC) analysis, six of the 24 DMCs (excluding the People's Republic of China) accounted for more than 85 percent of the infrastructure spend in 2015, and are likely to account for over three-quarter of the investment needed from 2016-2020. These countries are India, Indonesia, Malaysia, the Philippines, Thailand, and Vietnam.§
Although the combined net assets of these six countries' listed banks totaled $300 billion, it barely covers a fifth (20.8 percent) of the estimated shortfall in infrastructure investment in developing Asia (see Exhibit 12). These countries will have to break away from the traditional dependence on just public and bank financing to stand a chance in securing their projected investment needs. As such, funding from other private capital sources are necessary. To achieve this, regulatory and institutional reforms are crucial to ensure economic viability and attractiveness of PPP proposals, which would then enhance private sector participation and strengthen institutional capacity.
On the investment side, Preqin reports that the largest 100 Asian institutional investors' asset allocation to infrastructure only constitutes $65 billion - or 0.3 percent of their total assets under management (AuM) of $20 trillion.10 This amount is insufficient to even provide for 5 percent of the estimated infrastructure investment gap in developing Asia from 2016-2020.
However, private capital markets can be potential funding sources for infrastructure investments. An asset allocation shift of just 1-2 percent of their AuM from other asset classes into infrastructure, spread over five years, would already imply an average annual flow of between $40 to $80 billion - a substantial addition to infrastructure financing.
EXHIBIT 12: BANKS' NET ASSETS INSUFFICIENT IN MEETING ASIA'S INFRASTRUCTURE INVESTMENT AND GAP
$ TRILLIONS, 2016-2020
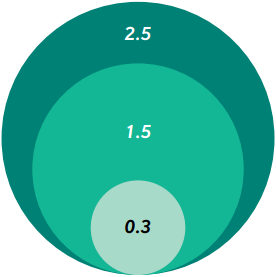

Estimated Future Infrastructure Investment Needs in Developing Asia (excluding PRC)

Estimated Infrastructure Investment Gap in Developing Asia (excluding PRC)

Total Net Assets of all listed banks of the key countries*1
*1 Countries include India, Indonesia, Malaysia, the Philippines, Thailand, and Vietnam
Source: APRC analysis of data from Asian Development Bank and Capital IQ
Increasingly new participants with larger risk appetites are playing larger roles in bridging the gap between "bankability" and "economic viability" e.g. energy traders and the range of pre-finance solutions they offer in exchange for access to infrastructure deficient markets. Abhimanyu Bhuchar, Partner, Oliver Wyman |
EXHIBIT 13: SIZE OF LOCAL CURRENCY BOND MARKETS (PERCENTAGE OF GDP)
|
| 2000 |
|
| 2015 |
|
| GOVERNMENT | CORPORATE | TOTAL | GOVERNMENT | CORPORATE | TOTAL |
PEOPLE'S REPUBLIC OF CHINA | 16.41 | 0.29 | 16.70 | 38.52 | 20.54 | 59.06 |
HONG KONG, CHINA | 8.12 | 27.16 | 35.28 | 38.68 | 28.73 | 67.41 |
INDIA | 28.57 | 6.16 | 34.74 | 40.70 | 14.09 | 54.79 |
INDONESIA | 35.39 | 1. 3 6 | 36.75 | 13.00 | 2.16 | 15.16 |
REPUBLIC OF KOREA | 24.37 | 46.32 | 70.69 | 52.74 | 76.90 | 129.64 |
MALAYSIA | 38.04 | 35.21 | 73.25 | 52.86 | 43.84 | 96.70 |
PHILIPPINES | 29.09 | 0.21 | 29.30 | 29.65 | 6.12 | 35.77 |
SINGAPORE | 26.17 | 20.58 | 46.75 | 45.52 | 32.22 | 77.74 |
THAILAND | 22.16 | 4.42 | 26.58 | 55.38 | 18.60 | 73.98 |
VIETNAM | 0.30 | - | 0.30 | 21.53 | 0.79 | 22.32 |
TOTAL | 56.03 | 19.34 | 75.36 | 71.26 | 21.98 | 93.25 |
Source: Asian Development Bank
An International Monetary Fund (IMF) report shows local currency debt for emerging markets has increased from $10.5 trillion in 2010 to $15 trillion in 2015, consistently making up 85-90 percent of total debt for emerging markets.22 A deep and liquid local currency bond market can play an important role in long term financing, especially with long term foreign currency exposure a key concern in emerging markets.
Further capital market deepening would help alleviate potential refinancing risks and reduce foreign currency exchange exposures, although established European and North American institutional investors typically have some degree of aversion to non-G8 currencies.
However, the maturity of local currency bond markets in Asia varies. Exhibit 13 shows that although most local currency bond markets in the region grew between 2000 and 2015, countries like Vietnam started from a low base while the market in Indonesia would appear to have regressed significantly.
The further development of local currency bond markets would significantly reduce the financing gap. However, non-bank institutional capital will continue to be crucial in supporting infrastructure financing, particularly in complex projects requiring either non-fixed income funding sources or where funding in dual currencies are required (reducing revenue versus financing currency mismatch). Partnering with these institutional investors will continue to be important for local deal sponsors and governments.
______________________________________________________________________________
§ APRC analysis by using 2015 GDP as a proxy for breakdown of individual estimated current investment (2015)
† Other important factors that contribute to this increase are the inclusion of all 45 ADB developing member countries compared to 32 in the 2009 report; and the use of 2015 prices versus 2008 prices
‡ Due to the lack of comprehensive and relevant data across countries, ADB focused on 25 developing member countries (DMCs) with adequate data to get an estimate of Asia-Pacific infrastructure investment spending in 2015. These 25 DMCs account for 96 percent of the region's population