INDONESIA
EXHIBIT 22: CORE COUNTRY INFRASTRUCTURE METRICS AND STATISTICS
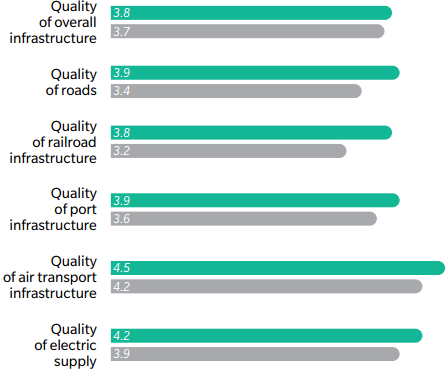
GLOBAL COMPETITIVENESS INDEX
| INFRASTRUCTURE SCORE |
| OVERALL RANKING | KEY INDICATORS*1 | |
|
|
|
|
50th | GDP per capita
Population
FDI, Net inflows (BoP) |


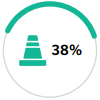
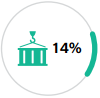
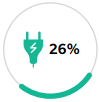
INDONESIA INFRASTRUCTURE SPEND IN 2015 (BREAKDOWN BY SECTOR)
$157 BILLION
|
|
|
|
|
|
| Rail Infrastructure | Road Infrastructure | Other Infrastructure Projects*2 | Electricity and Power | Telecommunications and Water Utilities*3 |

*1 World Bank's Data- 2015 figures all measured in current $
*2 Includes airports, dams, ports, land control systems, and inland waterway infrastructure
*3 Includes telecommunications, sewage infrastructure, and water infrastructure
Source: APRC analysis, World Economic Forum, Construction Intelligence Center
EXHIBIT 23: INDONESIA'S STREAMLINED PROJECT APPROVAL PROCESS
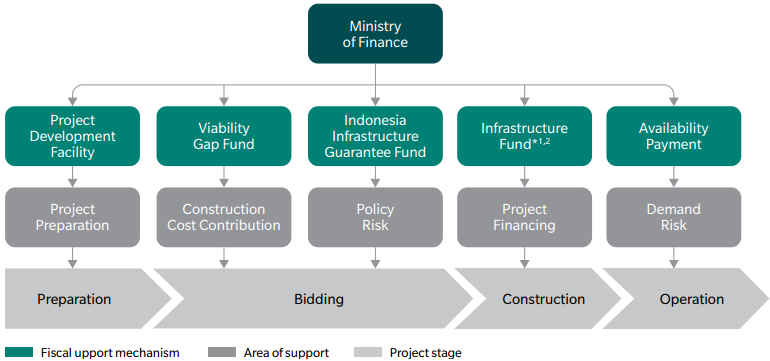
*1 SMI: PT Sarana Multi Infrastruktur
*2 IIF: PT Indonesia Infrastructure Finance
Source: APRC analysis, Indonesian Ministry of Finance
After taking office in October 2014, President Jokowi has, in his first term, set part of the National Medium-Term Development Plan (RPJMN) 2015-2019 to focus on developing infrastructure. The ambitious five-year infrastructure investment plan to also boost the country's economic growth consisted of constructing about 3,300 km of rail, 1,000 km of toll roads, 35 GW of electricity power plants, 24 new seaports, and 15 new airports, and will cost an estimated $85 billion annually till 2019.55