Sources of Growth and the Energy Price Plunge in Sub-Saharan Africa
The median recovery of income per worker after a sharp drop in commodity prices is about five years for the region as a whole. However, the speed of recovery appears to be slower for resource-abundant countries. What are the dynamics of the sources of growth underlying this recovery? What is the behavior of capital per worker and TFP across countries in the region after such a shock?
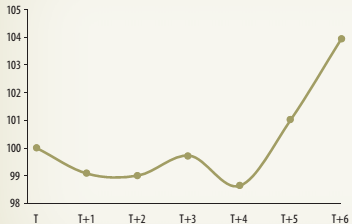
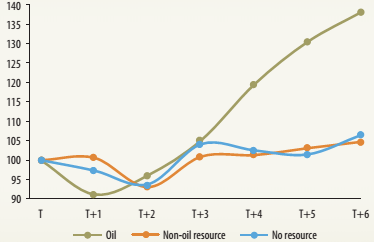
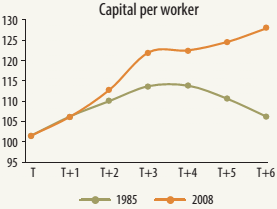
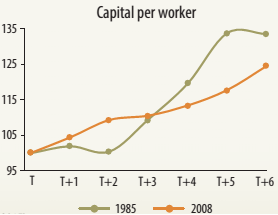
The behavior of capital per worker after a sharp deterioration of energy prices in Sub-Saharan Africa and selected country groups is plotted in figure 1A.3. For the region, capital per worker declines slightly over the next four years after the price decline, and increases afterward. The cumulative growth of capital per worker over the next five years after the commodity price shock is about 5 percent (figure 1A.3, panel a). When looking at country groups, non-oil and non-resource-rich countries have relatively unchanged levels of capital per worker throughout the six-year window. However, oil-rich countries experience a faster increase in capital per worker, which is attributed to a large stream of capital investment in the aftermath of this profound shock (figure 1A.3, panel b).
FIGURE 1A.3: Evolution of Capital per Worker after an Energy Price Plunge in Sub-Saharan Africa (weighted average, index) | Oil-rich countries experience a faster increase in capital per worker due to a large stream of capital investment in the aftermath of a shock. | |
a. Capital per worker
| b. Capital per worker, by group
| |
Source: Penn World Tables 9.0 (Feenstra, Inklaar and Timmer 2015). Note: All capital per worker figures are rescaled to 100 for year T (the peak year before the energy price plunge). | ||
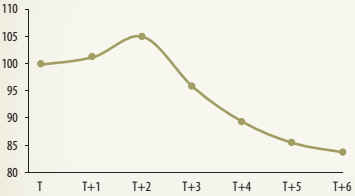
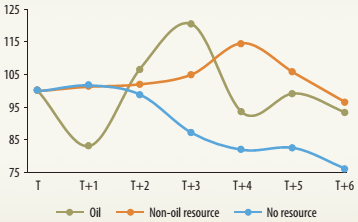
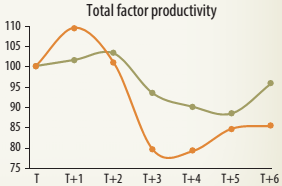
The evolution of TFP is presented in figure 1A.4. For the region, TFP shows a slight increase in the first two years after the shock, which might reflect the shedding of inefficient vis-à-vis efficient workers. Afterward, TFP exhibits a marked downward trend. In the sixth year after the shock, TFP in Sub-Saharan Africa is still 15 percent below pre-shock levels (figure 1A.4, panel a). Furthermore, the behavior of TFP over time is particularly striking among oil-rich countries. TFP fluctuations in oil-rich countries after the energy price plunge are much more volatile than in the other two groups. Such volatility in productivity may suggest a greater extent of resource misallocation within these economies, which, in turn, may inhibit sustained economic growth. Non-resource-rich countries in the region also show no productivity improvement, suggesting that economic growth was primarily driven by capital accumulation.
FIGURE 1A.4: Evolution of Total Factor Productivity after an Energy Price Plunge in Sub-Saharan Africa (weighted average, index) | Six years after the shock, TFP in Sub-Saharan Africa is still 15% below pre-shock levels. | |
a. Total factor productivity
| b. Total factor productivity, by group
| |
Source: Penn World Tables 9.0 (Feenstra, Inklaar and Timmer 2015). Note: All TFP figures are rescaled to 100 for year T (the peak year before the energy price plunge). | ||
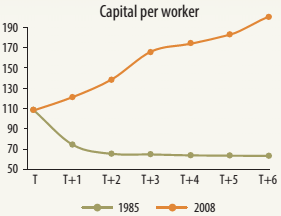
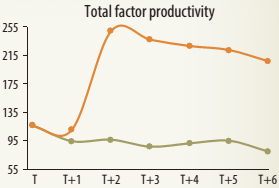
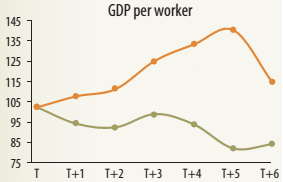
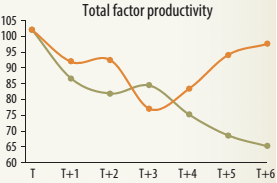
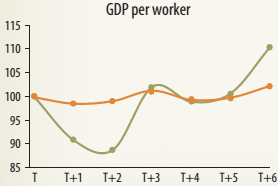
The response of GDP per worker, capital per worker, and TFP during the commodity price plunge, from their peaks in 1985 and 2008, is examined in figure 1A.5. Although the magnitude and persistence of the drop in energy prices may differ between these two episodes, one reason for their comparison is the difference in the nature of the sources of the price declines. The 1985 episode is explained by shocks that expanded the supply of energy (say, technological innovations, increased supply coming from the Soviet Union, and the Organization of the Petroleum Exporting Countries' mandate to maintain market shares rather than defend prices, among others). By contrast, the price collapse in 2008 is attributed to a global demand shock, as the level of economic activity was severely affected by the global financial crisis.5
Some interesting results emerge from figure 1A.5. First, the fall in output per worker (measured by the distance from peak to trough) is sharper in the 2008 episode than in 1985; however, the recovery after 2008 is faster. Second, the recovery of output per worker in 2008 is primarily driven by massive capital deepening-as shown by the steady increase in capital per worker. For the 1985 episode, capital per worker declines moderately and slowly converges to pre-shock levels. Third, TFP levels decline over time in both episodes-although at a faster pace in the 1985 episode. From these findings, it can be inferred that supply-driven commodity price collapses (compared with demand-driven ones) are associated with slow recoveries in output per worker, stagnant capital ratios, and sharper TFP declines.
FIGURE 1A.5: Not All Commodity Price Shocks Are Alike in Sub-Saharan Africa (index values) | ||
a. GDP per worker
| b. Capital per worker
| c. Total factor productivity
|
Source: Penn World Tables 9.0 (Feenstra, Inklaar and Timmer 2015). Note: All TFP figures are rescaled to 100 for year T (the peak year before the energy price plunge). GDP = gross domestic product; TFP = total factor productivity. | ||
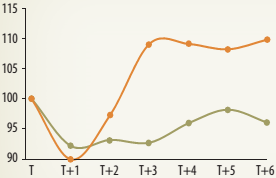
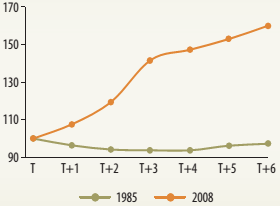
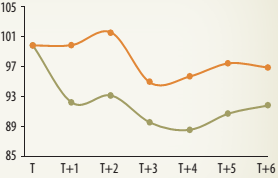
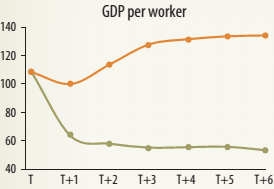
Figure 1A.6 depicts the evolution of GDP per worker, capital per worker, and TFP after the two commodity price shocks (1985 and 2008) across country groups in Sub-Saharan Africa classified by their extent of resource abundance. Interestingly, the figure shows that when the commodity price plunge is explained by supply shocks (the 1985 episode), the output drop is larger than when it is driven by demand shocks (the 2008 episode). Looking at the supply-driven shock, output per worker declines the most among resource-abundant countries, and it does not recover to previous peak levels after six years. In the case of non-resource-abundant countries, output recovers in the second year after the shock hits. The behavior of output per worker in each group is primarily explained by the evolution of TFP.
In sum, vulnerability to shocks represents a huge cost (in output and productivity) for countries in Sub- Saharan Africa. Plunging energy prices-along with relatively moderate declines in agriculture and metals prices-may have constrained or delayed the decision of African economies to implement growth-enhancing policies. Particularly vulnerable is the group of oil-rich economies, where recovery in output per worker comes along with massive capital deepening, and it is not accompanied by TFP growth. This situation implies that the growth recovery financed by investment programs may not provide the biggest bang for their buck. The recurrence of commodity price busts poses challenges to resource-abundant countries, once again, to formulate policies to withstand these adverse shocks. In this context, countries should not only rely on capital accumulation for sustained growth. They need to formulate policies to boost productivity and the efficient allocation of resources within and across their industries.
FIGURE 1A.6: Not All Commodity Price Shocks Are Alike, by Country Groups in Sub-Saharan Africa (weighted index values) | ||
A. Oil-abundant countries |
|
|
|
|
|
B. Non-oil-abundant countries |
|
|
|
|
|
C. Non-resource-abundant countries |
|
|
|
|
|
Source: Penn World Tables 9.0 (Feenstra, Inklaar and Timmer 2015). Note: All TFP figures are rescaled to 100 for year T (the peak year before the energy price plunge). | ||
_______________________________________________________________________________________________
5 The drivers of the 1985 price decline are more in line with those of 2014; see World Bank (2015) and Baffes et al. (2015).