What Drives the Accumulation of Exchange Market Pressures in Sub-Saharan Africa?
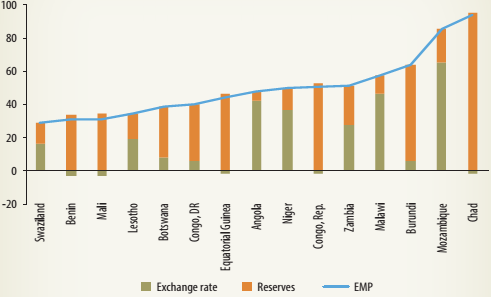
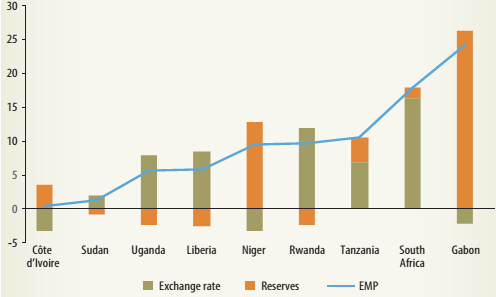
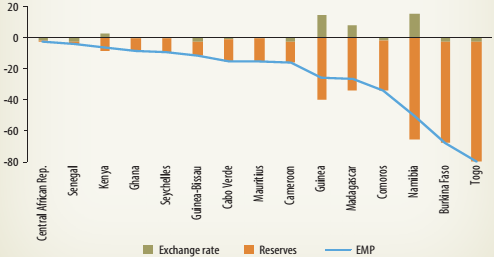
FIGURE 1B.1: Exchange Market Pressure, by Pressure Group EMP (April-September 2016)
EMP (April-September 2016)
EMP (April-September 2016)
Source: Calculation based on IMF International Financial Statistics. | What Drives the Accumulation of Exchange Market Pressures in Sub-Saharan Africa? According to the literature, domestic and global factors determine the level of exchange market pressures. Terms-of-trade and global interest rate shocks can have an impact on currency pressures in developing countries. Among domestic factors, the imposition of capital controls and the depth of financial markets may play a role (Bayoumi and Eichengreen 1998). Others argue that the strength of the macroeconomic framework-as signaled by money growth, long-term interest rates, and fiscal deficits-as well as external imbalances may put pressure on FX markets (Pentecost, Van Hooydonk, and Van Poeck 2001). Recent research by Aizenman and Hutchison 2012 finds that income per capita prior to a financial crisis, inflation, and the trade balance contribute to different degrees of EMP. The researchers also find that commodity-exporting emerging markets are more prone to the use of international reserves to mitigate exchange rate depreciation and absorb external pressures. Feldkircher et al. (2014) reinforce the finding that inflation is the most robust determinant of EMP during crises. They also add that the share of international reserves in GDP is related to the volatility of EMP during crisis periods. To examine the correlates of FX market pressures across countries, the EMP is regressed on a set of variables that includes Consumer Price Index (CPI) inflation, terms-of-trade changes, fiscal balance, current account, and three dummy variables that capture exchange rate flexibility (hard pegs and soft pegs) and oil abundance.8 The findings from the regression analysis are reported in table 1B.2.9 Column 1 reports the results of the baseline specification, which includes inflation, terms of trade, and dummy variables for oil dependence and exchange rate pegs. A positive and statistically significant coefficient is found for inflation. |
The estimated coefficient suggests that a one percentage point increase in CPI inflation adds 2.6 percent on the EMP index. Drivers other than CPI inflation fail to have a significant relationship with EMP. Column 2 shows a specification that includes terms-of-trade changes and the 2015 fiscal balances, as well as the dummy variables for oil abundance and exchange rate pegs. Terms-of-trade changes yield a negative and significant coefficient; that is, an increase in export prices (vis-à-vis import prices) reduces exchange market pressures-as the more favorable terms-of-trade tends to strengthen the currency. Furthermore, fiscal balances tend to have a negative and significant relationship with EMP.
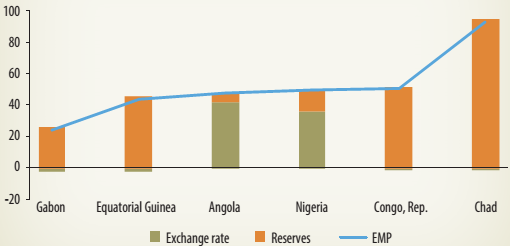
This finding suggests that an increase of one percentage point in the fiscal balance-to-GDP ratio reduces EMP by 3.2 percent. Column 3 combines the previous two specifications. Inflation remains significant, but none of the other variables reports any statistical significance. The fiscal balance is particularly noteworthy. The variable had a statistically significant coefficient in column 2, but it disappeared with the inclusion of CPI inflation in the model. This finding could imply that the impact of fiscal imbalance on EMP is an indirect one; that is, it is channeled through its impact on higher CPI inflation. | FIGURE 1B.2: Exchange Market Pressure on Oil-Rich Countries EMP (April-September 2016)
Source: Calculation based on IMF International Financial Statistics. |
Finally, column 4 includes the current account of the balance of payments as an additional determinant. When controlling for all the determinants, the econometric analysis still shows that inflation is the only variable yielding a significant coefficient. This finding implies that most macroeconomic outcomes-either fiscal imbalances or external imbalances-or global shocks-say, changes in the terms of trade-may affect EMP through their own effect on inflation.
Overall, Sub-Saharan African countries have recently shown substantial signs of FX market pressure. Macroeconomic fundamentals, such as the level of inflation, seem to spark pressure on countries regardless of the monetary arrangements in place. Furthermore, attention should be paid to countries that lack monetary or fiscal space-that is, countries with lower reserves and widened fiscal deficits-as they have a reduced margin for staving off the impact of shocks on their currencies-for example, CEMAC countries.
TABLE 1B.2: Correlates of Exchange Market Pressure
Dependent variable: Exchange market pressure index
Explanatory variable | (1) | (2) | (3) | (4) |
Inflation | 2.602*** (0.0630) |
| 2.592*** (0.100) | 2.664*** (0.114) |
Fiscal balance |
| -25.51* (12.42) | -0.226 (1.601) | 1.752 (1.995) |
Terms of trade | -0.330 (0.316) | -3.194** (1.431) | -0.340 (0.337) | -0.421 (0.324) |
Current account |
|
|
| -1.332 (0.834) |
Hard peg | 7.751 (14.69) | -56.98 (43.20) | 7.469 (15.14) | 13.28 (14.95) |
Soft peg | 15.11 (24.58) | 73.37 (79.13) | 14.88 (25.13) | 19.38 (26.19) |
Oil | 28.72 (22.97) | 28.28 (56.38) | 28.37 (23.90) | 24.60 (23.05) |
Constant | -14.68* (8.590) | -102.9 (63.20) | -15.58 (10.18) | -21.37* (10.43) |
Observations R-squared | 32 0.977 | 32 0.653 | 32 0.977 | 32 0.978 |
Note: Robust standard errors are in parentheses. *** p < 0.01, ** p <0 .05, * p < 0.1.
_______________________________________________________________________________________________
8 The terms-of-trade index is the export price index divided by the import price index, and the data used in the analysis are percentage changes between 2014 and 2015. The inflation data are for 2016, and the other macroeconomic variables are as of end-2015. The hard pegs dummy includes countries in CEMAC and WAEMU and Zimbabwe. The classification of soft peg countries is taken from the International Monetary Fund's Exchange Arrangements and Exchange Restrictions (link: http://www.elibrary-areaer.imf.org/). The oil-abundant country dummy takes a value of one when the resource rents coming from oil in the country exceed 10 percent of GDP.
9 Most of the explanatory variables are lagged, so problems of reverse causality are ameliorated.