INTRODUCTION
After two decades of per capita income growth rates that outpaced those of rich countries (Africa Rising), economic activity in the region has decelerated. There is an urgent need to regain the momentum on sustained growth. Amid an unfavorable external environment, observers in academic and policy circles are advocating a "big push" to help the region escape poverty and narrow the gap vis-à-vis the rest of the developing world (for example, Sachs et al. 2004; Collier 2006; IMF 2014). These calls for action propose a wide array of policy agendas; however, virtually all of them list infrastructure development among the top priorities in the region.
An adequate supply of infrastructure services has long been viewed as a key ingredient for economic development, in the academic literature (since the work of Aschauer 1989) as well as in policy debate (for example, World Bank 1994; IMF 2014). Over the past quarter century, academic research has devoted considerable effort to theoretical and empirical analysis of the contribution of infrastructure development to growth and productivity. More recently, increasing attention has also been paid to the impact of infrastructure on poverty and inequality (Estache 2005; World Bank 2003, 2006; Calderon and Serven 2004, 2010). Although the empirical literature on these two topics is far from unanimous, on the whole, a consensus has emerged that, under the right conditions, infrastructure development can play a major role in promoting growth and equity-and, through both channels, help reduce poverty.
Sub-Saharan Africa ranks at the bottom of all developing regions in virtually all dimensions of infrastructure performance. The region, in which almost one-seventh of the world lives, has a score of 2.91 in the World Economic Forums' (WEF's) Global Competitiveness Report.1 This score clearly states that there is a severe infrastructure bottleneck to be addressed. The region has some inherent characteristics that may enhance the potential role of infrastructure for its economic development-notably, the large number of landlocked countries, which are home to a major proportion of the region's total population (about 40 percent), and the remoteness of most of the region's economies from global market centers (Calderon and Serven 2010).2
Sub-Saharan Africa's geographic disadvantages result in high transport costs that hinder intra- and inter-regional trade (Limao and Venables 2001; Elbadawi, Mengistae, and Zeufack 2006; Behar and Manners 2008). Limited openness to trade is the main factor behind the stylized fact that, ceteris paribus, landlocked countries tend to grow slower than others. However, adequate transportation and communication facilities can help overcome these geographic disadvantages. The region's problem is that poor infrastructure adds to its geographic disadvantage.
The analysis in section 2 addresses several aspects of infrastructure in Sub-Saharan Africa. First, it presents information on the performance of infrastructure in the region along three broad dimensions: quantity, quality, and access. It examines the trends in these three dimensions from an international comparison perspective. Then it compares infrastructure trends in the region with other benchmark regions, and the performance of countries in Sub-Saharan Africa is compared vis-à-vis their level of development while accounting for demographic and geographic drivers. Second, the section explores the relationship between infrastructure growth and economic growth in Sub-Saharan Africa. The potential growth benefits of closing the infrastructure gap in the region and the financing needs are considered. Third, it documents the stylized facts on public investment in the region, presents granular information on public spending collected by the BOOST initiative, and takes stock of public-private partnerships (PPPs) in infrastructure. Finally, the section examines the quality of infrastructure spending-as measured by the quality of public investment management systems and procurement methods.
A few conceptual issues about infrastructure are summarized in box 2.1.
A host of issues drive the gaps in infrastructure in the Africa region, beyond the financing gap. For instance, there is a lack of commitment to sustainable tariffs in infrastructure services, such as electric power, transport, and water. Yet, there is heavy reliance on public subsidies. Another problem is the poor performance of public utilities-affected not only by weak management, but also political interference. There is lack of political support for sector reforms that will help crowd in private investment in infrastructure-for example, opposition from state-owned enterprises (SOEs) to PPPs. In addition, domestic capital markets are not deep enough to provide local-currency long-term debt for infrastructure and, in some jurisdictions, tax systems may discourage the issuance of infrastructure-related bonds (for example, South Africa). Finally, an in-depth discussion of the issues mentioned above-although very relevant to understand infrastructure gaps in the region-goes beyond the scope of this section.
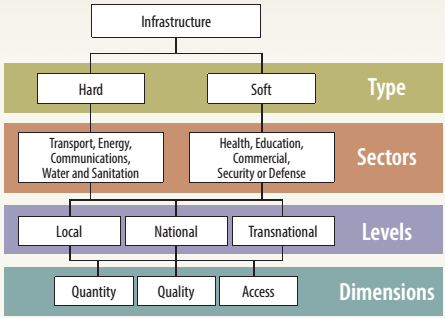
| BOX 2.1: | What is meant by infrastructure has evolved; it is now generally defined as a complex array of capital goods that provide services in combination with other inputs (Prud'Homme 2004; Snieska and Simkunaite 2009). Infrastructure can be identified by five characteristics (Kay 1990). First, infrastructure projects can be described as networks, which involve delivery systems and allow significant interactions in the provision of services to individual customers (Oughton and Tyler 2013). As a network is a public good, other individuals can still use it when delivered. This type of infrastructure is referred to as collective capital goods. The fact that individuals use these collective goods makes it difficult to reveal consumer preferences. Second, when infrastructure is built, new projects form a small part of the total cost of the wide range of products in which they are used. In the case of service failure, the corrective cost becomes very large compared with the basic cost of service production (Ahmed and Donovan 1992). Since changing the marginal cost results in no revenues, and the users would always try to find someone else to pay for the service attained, or free-ride due to the lack of properly declared property rights, it becomes difficult for the private sector to be entirely responsible for infrastructure provision (Coase 1937; Varian and Repcheck 2010). Third, infrastructure construction results in monopolistic elements. In turn, these elements rely on the combination of durable and immobile investments, and provide strong economies of scale. The government seeks control over the private sector in the delivery of infrastructure services, due to the lack of competition (that is, the high cost of network building). Regulation is a partial solution to setting fair rules over the relationship between the government and the private sector (Gómez-Ibañez 2003). Fourth, the capital cost of infrastructure might be larger than its running cost. Fifth, infrastructure projects usually incur relatively important sunk costs (Kay 1990). These are considerable proportions of the service's total cost, and have already been covered before the service has been used (Ahmed and Donovan 2002). Infrastructure can be classified into hard or soft, which some call economic or social (Jerome 1999; Fourie 2006; Perkins, Fedderke, and Luiz 2005; Snieska and Simkunaite 2009) (figure B2.1.1). Soft or social infrastructure refers to the social, political, and cultural institutions and services supporting a community or nation (Wanmali and Islam 1997). Soft infrastructure includes different sectors, namely, education, commercial, housing, and security or defense. Hard or economic infrastructure refers to large physical networks that are needed to promote economic activity and maintain a functioning nation (Ahmed and Donovan 1992; Hansen 1965; Hirschman 1958). Hard infrastructure is typically classified into five sectors: telecommunications, transport, energy, water and sanitation, and solid waste (Diewert 1986; Calderón and Sérven 2004; Gómez-Ibañez 2003; Oughton and Tyler 2013). | |
| Hard and soft infrastructure comprise different sectors. At the same time, there is a great deal of heterogeneity within a single sector. For instance, the transportation sector includes roads, airports, water ports, railways, and subways, and each of these subsectors is characterized by different costs, planning techniques, and maintenance requirements. Furthermore, the energy sector is also composed of heterogeneous subsectors, like electric energy, hydro energy, gas, and oil, among others. Another element to consider in the definition of economic infrastructure is its level, namely, local, national, and transnational (Fourie 2006).a The level adds spatial dependence and spatial heterogeneity to the data. The level is also relevant because it builds a component of endogenous placement for infrastructure (Anselin 1988). For instance, it might not be necessary to have a dam in every state-because a dam might provide services to neighboring states. Sharing a border and complying with globalization decisions will also affect the mode of infrastructure provision. For instance, very localized and globalized goods are becoming more important because of technological improvements (Fourie 2006; Taylor 2010). | FIGURE B2.1.1: Infrastructure Classification
Source: World Bank staff. | |
| Finally, infrastructure (economic and social) is a multidimensional concept: it involves measuring quantity, quality, and access (Rietveld and Bruinsma 2012; Calderón and Servén 2008). The quantity dimension refers to stocks of infrastructure-that is, physical capacity. It may also refer to flows-as proxied by measures of consumption and/or production. Measuring the quality dimension of infrastructure is not trivial. Typically, it is measured by qualitative indicators, like those in the World Economic Forum's Global Competitiveness Report. These indicators survey perceptions on the quality of infrastructure services.b However, the set of objective measures for quality is limited, namely, the share of paved roads in the transport sector, or the percentage of distribution and transmission losses in electric energy in the energy sector. The third dimension is access. Most research focused on the impact of infrastructure on growth and productivity relies on quantity measures. Recent efforts to have a better assessment on the growth effects of infrastructure include the quality dimension (Calderón and Servén 2004, 2010; Loayza and Odawara 2010).c The access dimension is mostly used in studies of inequality or poverty. However, all the elements of infrastructure-dimension, level, sector, and type-coexist in the area of development.
b. The World Economic Forum (WEF) report surveys executives on their perception of the quality of different infrastructure sectors. These WEF measures on the quality of infrastructure are highly correlated with the corresponding quantity measures of road transport, electricity, and telecommunications. See Albino-War et al. (2014), Calderon, Cantu and Serven (forthcoming). c. Where the information is available. Source: Cantu (2017). | ||
_______________________________________________________________________________________________
1 This index takes values from 0 to 7 and higher scores indicate more competitiveness.
2 Storeygard (2016) argues that the lack of infrastructure could also reflect the low population density in the region-which may play a role in explaining the low maintenance of most infrastructure networks.