Infrastructure Quantity
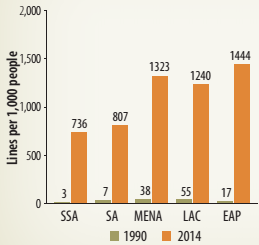
Telecommunications. Sub-Saharan Africa has seen a dramatic jump in telecommunications density over the past quarter century. The median number of fixed and mobile phone lines per 1,000 people has risen sharply, from three in 1990 to 736 in 2014 (figure 2.1). A similar pattern is observed in other benchmark regions in the world, reflecting the global nature of the boom in mobile phone technology. A comparison of telecommunications density across regions shows that, despite a surge, Sub-Saharan Africa lags behind other regions.
| FIGURE 2.1: Telecommunications Infrastructure Quantity, by Region | |||
| (a). Telecommunications density
| b. Internet density
| c. Fixed broadband
| Sub-Saharan Africa has made great progress in telecommunications density. |
| Sources: International Telecommunications Union's World Telecommunication/ICT indicators; World Bank, World Development Indicators. Note: EAP = East Asia and the Pacific; LAC = Latin America and the Caribbean; MENA = Middle East and North Africa; SA = South Asia; SSA = Sub-Saharan Africa. | |||
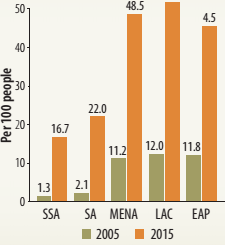
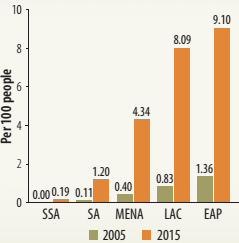
Modern technological innovation has provided other forms of telecommunications connectivity among people. In this context, the number of Internet users and fixed broadband subscriptions (both normalized by population) are proxies for telecommunications density other than phone lines. Internet density-as measured by the number of users per 100 people-in Sub-Saharan Africa in 2015 was only 16.7, less than that of any other benchmark region. Another indicator of Internet penetration is the number of fixed broadband subscriptions per 100 people.3 Again, Sub-Saharan Africa, with a penetration rate of only 0.19, lags other regions.
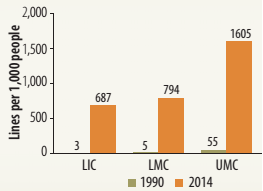
Within Sub-Saharan Africa, gains are observed across all income groups. Telecommunications density expanded at the fastest pace among the region's LICs, although starting from low levels. Specifically, the number of fixed and mobile phones per 1,000 people grew among LICs, from three in 1990 to 687 in 2014 (figure 2.2). Moreover, the gap in telecommunications density relative to UMCs has narrowed significantly for LICs and LMCs over the past two decades. For instance, telecommunications density was only twice as high in UMCs compared with LMCs in 2014 (it was 11-fold in 1990). The fast growth of telecommunications density over the past two decades among the region's UMCs, increasing from 55 lines per 1,000 people in 1990, to 1,605 in 2014, has placed this group above the medians of other regions.
| Telecommunications density expanded at the fastest pace among the region's Low Income Countries. | FIGURE 2.2: Telecommunications Infrastructure Quantity in Sub-Saharan Africa, by Income | ||
| (a). Telecommunications density
| b. Internet density
| c. Fixed broadband
| |
| Sources: International Telecommunications Union's World Telecommunication/ICT indicators; World Bank, World Development Indicators. Note: LIC = low-income countries; LMC = lower-middle-income countries; SSA = Sub-Saharan Africa; UMC = upper-middle-income countries. | |||
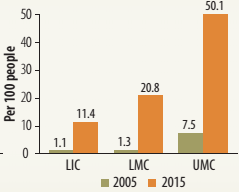
Internet density has risen sharply over the past two decades for all income groups in Sub-Saharan Africa. For instance, the number of Internet users increased from 1.1 per 100 people in 2005, to about 11.4 in 2015 among LICs, while it grew from 7.5 to 50.1 for UMCs. Fast growth of Internet density among LICs and LMCs in the region has narrowed their gap relative to UMCs. Finally, the extent of Internet density among Sub-Saharan Africa's UMCs is above the regional median of countries in East Asia and the Pacific (45.5 users per 100 countries).
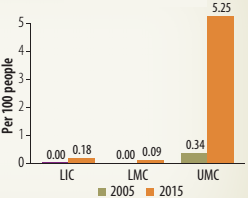
Reflecting the regional aggregate, the density of fixed broadband subscriptions is dismal for virtually all income groups in Sub-Saharan Africa. Notwithstanding the low penetration, there is a very large gap between the region's LICs and LMCs relative to UMCs. At the same time, the density of fixed broadband across UMCs (5.25 subscriptions per 100 people) is lower than that of Latin America and East Asia (8.1 and 9.1 subscriptions per 100 people, respectively).
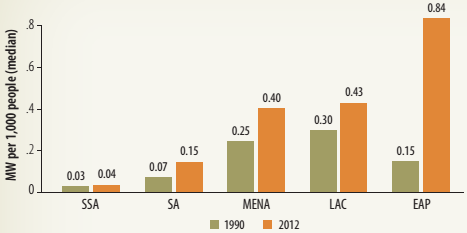
Power. Sub-Saharan Africa was vastly outperformed by the other benchmark developing regions in the power sector in 2012. The electricity-generating capacity of the region has changed little in over 20 years and is about 0.04 megawatts (MW) per 1,000 people-that is, less than a third of that of South Asia (with 0.15) and less than one-tenth of that of Latin America and the Caribbean (figure 2.3). Among the regions studied, East Asia and the Pacific registered the fastest growth in powergenerating capacity over the past two decades-jumping from 0.15 MW per 1,000 people in 1990 to 0.84.
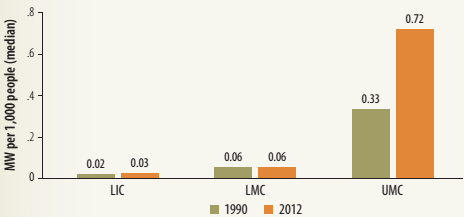
Insufficient electricity-generating capacity in Sub-Saharan Africa is explained by the trends observed in LICs and LMCs. There has been slight or no progress in MW of installed capacity per 1,000 people over the past two decades for these groups of countries; that is, keeping capacity at at a low 0.03 and 0.06 MW per 1,000 people for LICs and LMCs, respectively, by 2012 (figure 2.4). Electricity generating capacity more than doubled among UMCs, growing from 0.33 MW per 1,000 people in 1990, to 0.72 MW per 1,000 people in 2012.
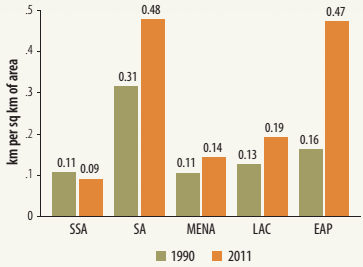
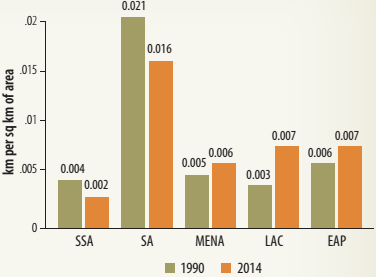
| Transport. Assessing the performance of transport infrastructure involves examination of the trends in the lengths of road and rail networks (expressed in kilometers (km)) - in this case, normalized by the surface area of the country (in square km). In 2011, Sub-Saharan Africa registered the lowest road density among the developing regions under analysis (figure 2.5). Moreover, Sub-Saharan Africa is the only region were road density has declined over the past 20 years. The density of the railroad network is likewise low, at less than 0.002 km per square km of surface area by 2014, and this density has been declining. Although South Asia has also seen a decline in rail density, it continues to outperform other regions in this measure.
| FIGURE 2.3: Quantity of Power Infrastructure: Electricity-Generating Capacity, by Region
Source: International Energy Agency, World Energy Outlook. Note: EAP = East Asia and the Pacific; LAC = Latin America and the Caribbean; MENA = Middle East and North Africa; MW = megawatts; SA = South Asia; SSA = Sub-Saharan Africa. FIGURE 2.4: Quantity of Power Infrastructure in Sub-Saharan Africa: Electricity-Generating Capacity, by Income
Source: International Energy Agency, World Energy Outlook. Note: LIC = low-income countries; LMC = lower-middle-income countries; MW = megawatts; SSA = Sub-Saharan Africa; UMC = upper-middle-income countries. | The electricity-generating capacity of the region has changed little in over 20 years. |
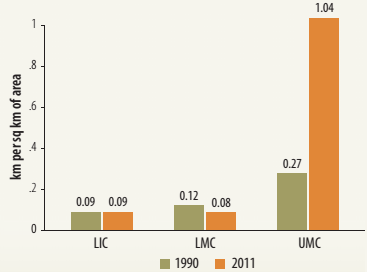
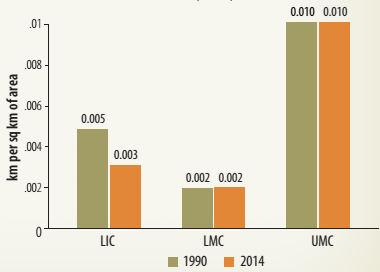
The evolution of road density across income groups in Sub-Saharan Africa over the past two decades shows that road density has declined over time among LMCs (figure 2.6). This might capture the fact that the expansion of the road network is not as fast as the pace of urbanization in these countries. The data also reveal a large gap in road density for LICs and LMCs relative to UMCs, and that this gap has increased sharply over time. Finally, the road density among UMCs in Sub-Saharan Africa (1.04 km per square km of surface area) is larger than the regional median of all other developing regions. The trends observed in railroad density are similar to those in roads: there has been a decline in the density of railroads among the region's LICs and LMCs over the past two decades, which might be attributed to poor maintenance. At the same time, railroad density remained almost invariant among UMCs, and it was outperformed only by South Asia.
| Sub-Saharan Africa is the only region where road density has declined over the past 20 years.
| FIGURE 2.5: Quantity of Transport Infrastructure: Road and Railroad Density, by Region | |
| a. Road density
|
b. Railroad density
| |
| Sources: International Road Federation, World Road Statistics; World Bank, World Development Indicators. Note: EAP = East Asia and the Pacific; km = kilometers; LAC = Latin America and the Caribbean; MENA = Middle East and North Africa; SA = South Asia; SSA = Sub-Saharan Africa. | ||
| FIGURE 2.6: Quantity of Transport Infrastructure in Sub-Saharan Africa: Road and Railroad Density, by Income | ||
| a. Road density
| b. Railroad density
| |
| Sources: International Road Federation, World Road Statistics; World Bank, World Development Indicators. Note: km = kilometers; LIC = low-income countries; LMC = lower-middle-income countries; SSA = Sub-Saharan Africa; UMC = upper-middle-income countries. | ||
_______________________________________________________________________________________________
3 This indicator refers to fixed subscriptions to high-speed access to public Internet, at downstream speeds equal to or greater than 256 kilobits per second.