Infrastructure Quality
It is imperative for the region to reduce the gap in the quantity of infrastructure. At the same time, the quality of these service-providing capital goods will be the major contributor to their optimal usage. The quality measures examined here can be objective or subjective. The former refers to hard measurements (for example, electric power and transmission losses); the latter refers to perceptions of the quality and reliability of these services obtained from entrepreneur services-such as the quality of infrastructure indicators from the WEF's Global Competitiveness Report.4
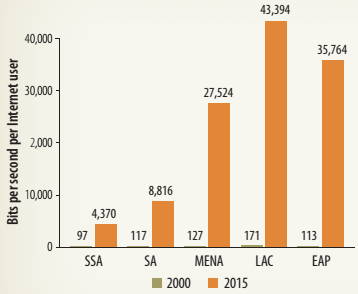
Telecommunications. Lack of data availability across sectors and, more importantly, over time prevents us from capturing the quality of the services of fixed telephone and mobile lines. However, the quality of Internet services can be approximated by the international bandwidth connection (which captures used capacity and average traffic load). Over the past 15 years, there has been a broad-based increase in Internet speed throughout the world. In Sub-Saharan Africa, the bits per second per Internet user grew from 97 in 2000, to 4,370 in 2015 (figure 2.7). In South Asia, this indicator is nearly twice as large (8,816), and in the remaining regions it is between 27,000 and 44,000 bits per second per Internet user.
| FIGURE 2.7: Quality of Telecommunications Infrastructure: Internet Traffic | Internet capacity increased in Sub-Saharan Africa, with upper-middle-income countries leading the way. | |
| a. By region
| b. By income
| |
| Sources: International Telecommunications Union's World Telecommunication/ICT indicators; World Bank, World Development Indicators. Note: EAP = East Asia and the Pacific; LAC = Latin America and the Caribbean; LIC = low-income countries; LMC = lower-middle-income countries MENA = Middle East and North Africa; SA = South Asia; SSA = Sub-Saharan Africa; UMC = upper-middle-income countries. | ||
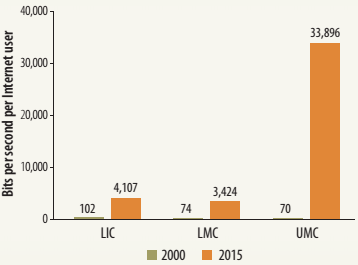
There has been an increase in capacity and traffic on the Internet for all income groups in Sub-Saharan Africa. The largest improvement is evidenced for UMCs, with this group seeing Internet traffic volume greater than the regional median of other developing areas-except East Asia and Latin America (35,764 and 43,394 bits per second for every user, respectively).
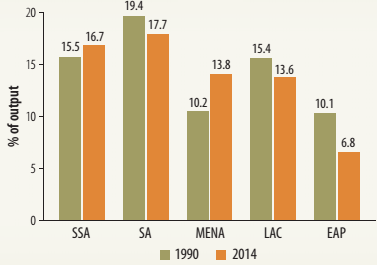
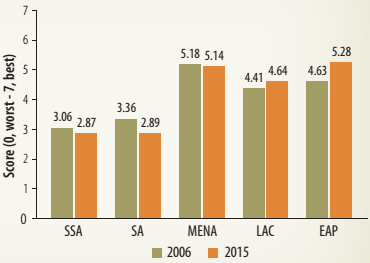
Power. One measure of the quality of the power infrastructure sector is captured by the percentage of electric power transmission and distribution losses (as a percentage of electricity output). Figure 2.8 depicts that electric power losses increased in Sub-Saharan Africa over the past quarter century, from 15.5 percent in 1990, to 16.7 percent in 2014, while declining in most other regions. Another measure of the quality of power supply is from WEF; it is a qualitative indicator that fluctuates from a low of 0 to a high of 7. According to this indicator, the perceived quality of power supply in the region dipped from 3.1 to 2.9 between 2006 and 2015. Sub-Saharan Africa registered the lowest scores in quality of power supply in 2015, with a regional median of 2.9, practically the same as for South Asia, which also experienced a decline in quality. Other benchmark regions, such as Latin America and the Caribbean and East Asia and the Pacific, saw an improving trend in quality and scored above 4.5.
| The quality of power supply in the region declined between 2006 and 2015. | FIGURE 2.8: Quality of Power Infrastructure, by Region | |
| a. Power losses
| b. Quality of power supply
| |
| Sources: World Bank, World Development Indicators; World Economic Forum, Global Competitiveness Report. Note: EAP = East Asia and the Pacific; LAC = Latin America and the Caribbean; MENA = Middle East and North Africa; SA = South Asia; SSA = Sub-Saharan Africa. | ||
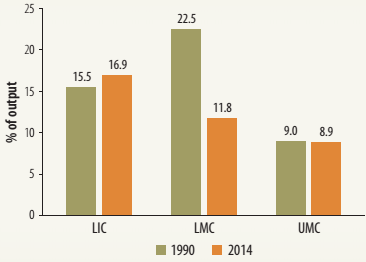
Within Sub-Saharan Africa, there is considerable disparity in the evolution over time of power losses across the different income groups. For instance, power losses declined sharply in LMCs, to 11.8 percent of output in 2014, from 22.5 percent in 1990; power losses in UMCs remained almost invariant over the past decade (figure 2.9). By contrast, power losses slightly increased, from 15.5 percent of output to 16.9 percent during this period among the region's LICs. Power losses in Sub-Saharan Africa's LMCs and UMCs are smaller than those in other regions, with the exception of East Asia.
| The decline in the quality of power is evident in the continent's lower-middle-income countries. | FIGURE 2.9: Quality of Power Infrastructure in Sub-Saharan Africa, by Income | |
| a. Power losses
| b. Quality of power supply
| |
| Sources: World Bank, World Development Indicators; World Economic Forum, Global Competitiveness Report. Note: EAP = East Asia and the Pacific; LAC = Latin America and the Caribbean; LIC = low-income countries; LMC = lower-middle-income countries; MENA = Middle East and North Africa; SA = South Asia; SSA = Sub-Saharan Africa; UMC = upper-middle-income countries. | ||
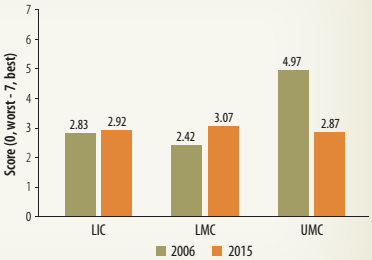
The perception of the quality of power supply in the region is comparable across income groups. This convergence is the outcome of different trends between 2006 and 2015: quality increased slightly among LICs, varying between 2.8 and 2.9; it increased from 2.4 to 3.1 among LMCs; and it declined sharply among UMCs, from about 5 to 2.9.
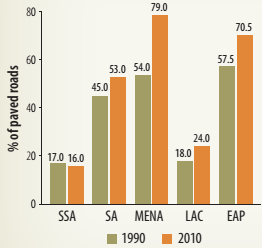
Transport. The quality of transport infrastructure is measured by (a) the share of paved roads in total roads, and (b) the WEF perception scores on the quality of roads and railroads. The results with the hard measures should be taken with caution, as not all road networks in the country are meant to be paved. Other likely measures-for example, percentage of roads in good condition-are not available for the wide array of countries and over time.
Figure 2.10 shows that in Sub-Saharan Africa the share of paved road declined from 17 percent in 1990 to 16 percent in 2010, bucking the rising trend observed in other regions. Sub-Saharan Africa also has the lowest share of paved roads in the total road network of any region, and well below that of South Asia (53 percent) and East Asia and the Pacific (71 percent).
| FIGURE 2.10: Quality of Transport Infrastructure: Share of Paved Roads and WEF Perception of Road and Railroad Quality, by Region | Road quality continues to be a problem in the continent. | ||
| a. Share of paved roads
| b. Road quality
| c. Railroad quality
| |
| Sources: International Road Federation, World Road Statistics; World Bank, World Development Indicators; World Economic Forum, Global Competitiveness Report. Note: EAP = East Asia and the Pacific; LAC = Latin America and the Caribbean; MENA = Middle East and North Africa; SA = South Asia; SSA = Sub-Saharan Africa. | |||
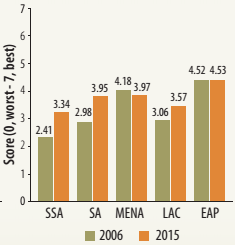
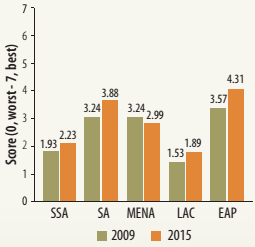
The perception of road quality in Sub-Saharan Africa, as well as in other developing regions, shows an improving trend during 2006-15. WEF scores for Sub-Saharan Africa on perceived road quality climbed from 2.4 in 2006, to 3.3 in 2015. Still, Sub-Saharan Africa is the weakest performing region in this category of quality, well below the score of 4.5 for East Asia and the Pacific. There is also a slight increase in the surveyed perception of railroad quality in Sub-Saharan Africa, from a score of 1.9 in 2006, to 2.2 in 2015. But the region has among the lowest perceptions of railroad quality among developing regions, and is well below regions such as South Asia and East Asia, which have scores in the range of 3.9 and 4.3, respectively.
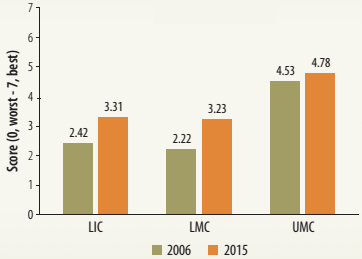
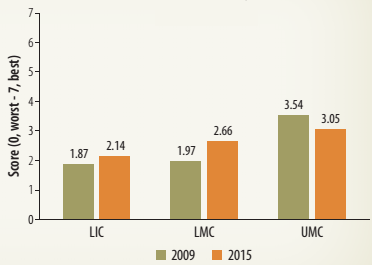
The share of paved roads in total roads is similar across income groups in Sub-Saharan Africa for 1990 (in the range of 16.5 to 17 percent). It grew slightly to 18 percent among LICs and declined to 10 percent among LMCs.5 The trends in perceived road quality are quite different from those of the share of paved roads in the total road network. First, the perception of road quality increased for all income groups in Sub-Saharan Africa-although at different rates (figure 2.11). Second, at a score of 4.8, the median perception of road quality among UMCs in Sub-Saharan Africa outperforms the regional median of other developing areas. The evolution of the perception of railroad quality for the different country groups in Sub-Saharan Africa during 2006-15 shows improvement among LICs and LMCs in the region, and a decline among UMCs.
| Even though perceptions of road quality improved in Sub-Saharan Africa, it is still the weakest performing region in the world. | FIGURE 2.11: Quality of Transport Infrastructure in Sub-Saharan Africa: WEF Perception of Road and Railroad Quality, by Income | |
| a. Power losses
| b. Quality of power supply
| |
| Source: World Economic Forum, Global Competitiveness Report. Note: LIC = low-income countries; LMC = lower-middle-income countries; SSA = Sub-Saharan Africa; UMC = upper-middle-income countries. | ||
_______________________________________________________________________________________________
4 It is important to note that this survey, which was conducted by the WEF's Global Competitiveness Report, captures the perceptions of businesspeople about the quality of infrastructure in the country. These indicators take values from zero (worst) to seven (best). The periods under analysis for this section are 2006 and 2015.
5 For UMCs, we do not have available information for that year.