Infrastructure Access
The performance of the infrastructure sector relies not only on quantity and quality, but also on the universality of access. From the point of view of equality of opportunities and poverty reduction, it is important to examine the extent to which infrastructure assets yield services to the broad population rather than just a few. This subsection discusses the evolution of indicators of access to electricity, safe water sources, and improved sanitation facilities.
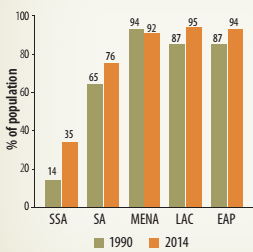
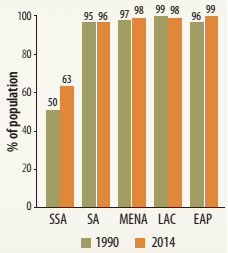
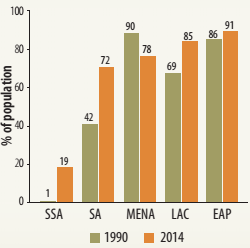
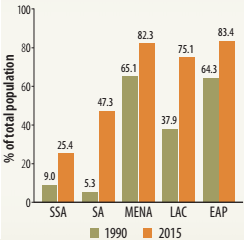
Access to electricity. Figure 2.12 presents the percentage of the population with access to electricity in Sub-Saharan Africa and other developing areas for 1990 and 2014. The figure depicts overall access as well as access rates for urban and rural populations. The data show that total rates of access to electricity more than doubled during this period, growing from 14 percent in 1990, to 35 percent in 2014. Yet, all developing regions significantly outperformed Sub-Saharan Africa in access to electricity in 2014, with universal access to electricity in East Asia. The disparity in rates of access to electricity between urban and rural areas is especially marked in Sub-Saharan Africa, where about 63 percent of the urban population and only 19 percent of the rural population had access to electricity in 2014.
| FIGURE 2.12: Access to Electricity: Total, Urban, and Rural Access Rates, by Region | Access to electricity in the region more than doubled during 1990-2014. | ||
| a. Access to electricity
| b. Urban access to electricity
| c. Rural access to electricity
| |
| Source: World Bank, World Development Indicators. Note: EAP = East Asia and the Pacific; LAC = Latin America and the Caribbean; MENA = Middle East and North Africa; SA = South Asia; SSA = Sub-Saharan Africa. | |||
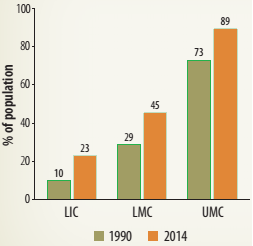
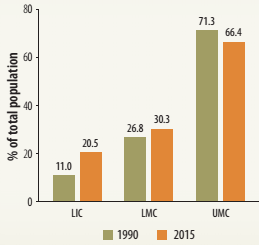
Access to electricity has increased across all Sub-Saharan Africa income groups over the past two decades-although at a slower pace among LICs. Overall access rates to electricity went from 10 percent in 1990, to 23 percent in 2014 among this income group, while it increased from 29 to 45 percent among LMCs over the same period (figure 2.13). The region's UMCs have the largest overall access rate to electricity (with 89 percent of the population in 2014).
| FIGURE 2.13: Access to Electricity in Sub-Saharan Africa, by Income: Total, Urban, and Rural Access Rates | Access to electricity has improved for all income groups. | ||
| a. Access to electricity
| b. Urban access to electricity
| c. Rural access to electricity
| |
| Source: World Bank, World Development Indicators. Note: LIC = low-income countries; LMC = lower-middle-income countries; SSA = Sub-Saharan Africa; UMC = upper-middle-income countries. | |||
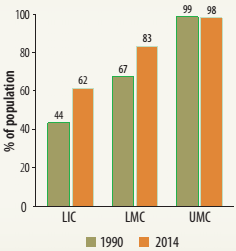
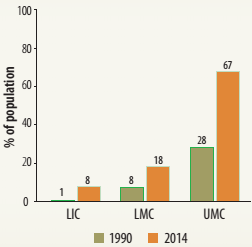
The fast increase in the overall access rate in the region is driven by rising rural access rates - although they were coming from low levels in 1990. Yet, there is a great disparity between urban and rural rates of access to electricity across income groups in Sub-Saharan Africa. For instance, about 63 percent of the urban population had access to electricity in 2014, while only 19 percent had access in rural areas. The urban and rural rates of access for the region's LMCs are 83 and 18 percent, respectively. Finally, the rural rate of access to electricity in UMCs (about 67 percent) is still below than that of other developing regions.
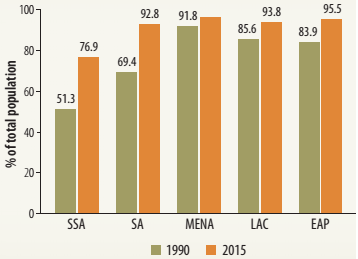
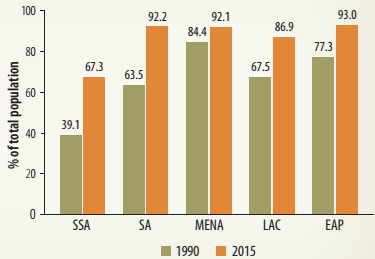
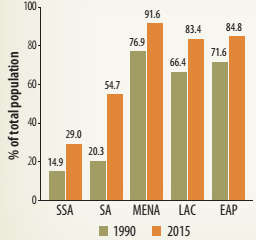
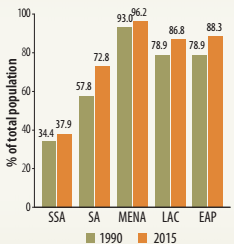
Access to safe water. Total access rates to improved sources of water grew sharply in Sub-Saharan Africa over the past quarter century (to a median of 77 percent in 2015, from 51 percent in 1990). Although more than three-fourths of the region's population had access to water in 2015, other benchmark regions have access rates that exceed 90 percent (figure 2.14). Again there is a large disparity in urban and rural access rates in Sub-Saharan Africa, despite the sharp growth of urban access. In 2015, more than 90 percent of the urban population had access to water, while only 67 percent had access in rural areas. For other developing regions, rural access exceeded 85 percent of the population.
| Sub-Saharan Africa has a large disparity in water access rates between urban and rural areas. | FIGURE 2.14: Access to Water Infrastructure: Total and Rural Access Rates, by Region | |
| a. Access to water
| b. Rural access to water
| |
| Source: World Bank, World Development Indicators. Note: EAP = East Asia and the Pacific; LAC = Latin America and the Caribbean; MENA = Middle East and North Africa; SA = South Asia; SSA = Sub-Saharan Africa. | ||
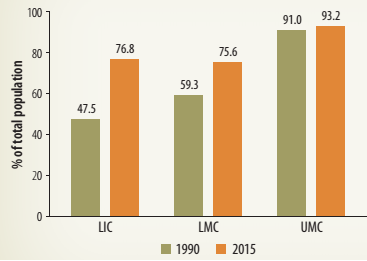
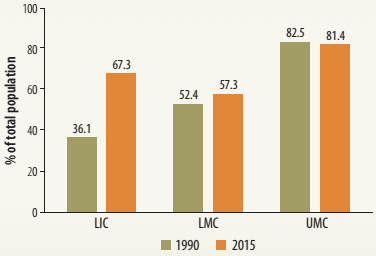
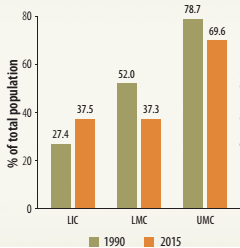
The percentage of the population with access to improved sources of water increased over the past quarter century across all income groups in Sub-Saharan Africa-with LICs showing the larger rates of improvement. Their overall access rates jumped from 48 percent in 1990, to 77 percent in 2015. The disparities across income groups are driven by those in rural areas. Interestingly, a greater proportion of the rural population has access to water among LICs in the region (67 percent in 2015) than among LMCs (57 percent) (figure 2.15). Among UMCs in the region, access is above 90 percent in urban areas, while it covers 81 percent of the population in rural areas. In spite of covering four-fifths of the rural population in 2015, rural access rates among UMCs in Sub-Saharan Africa are not higher than those in other developing areas.
| FIGURE 2.15: Access to Water Infrastructure in Sub-Saharan Africa, by Income: Total and Rural Access Rates | Access to improved sources of water increased across all income groups in Sub-Saharan Africa-with low-income countries showing the largest improvement. | |
| a. Access to water infrastructure
| b. Rural access to water
| |
| Source: World Bank, World Development Indicators. Note: LIC = low-income countries; LMC = lower-middle-income countries; SSA = Sub-Saharan Africa; UMC = upper-middle-income countries. | ||
Access to improved sanitation facilities. Over the past quarter century, Sub-Saharan Africa has doubled total access rates to sanitation; however, they are still low relative to other benchmark regions. Sanitation access rates went from 15 percent in 1990, to about 30 percent in 2015 (figure 2.16). In 2015, about 55 percent of the population of South Asia had access to sanitation facilities, while that proportion exceeded 80 percent for Latin America and the Caribbean and East Asia. With a rate of 38 percent, access to sanitation has changed little for Sub-Saharan Africa's urban population. In the region's rural areas, only 25 of every 100 people had access to improved sanitation facilities in 2015, up from 9 in 1990.
| FIGURE 2.16: Access to Sanitation Infrastructure, by Region: Total, Urban, and Rural Access Rates | Access to sanitation in the region has doubled in the past 25 years, but remains low in comparison with other parts of the world. | ||
| a. Access to sanitation
| b. Urban access to sanitation
| c. Rural access to sanitation
| |
| Source: World Bank, World Development Indicators. Note: EAP = East Asia and the Pacific; LAC = Latin America and the Caribbean; MENA = Middle East and North Africa; SA = South Asia; SSA = Sub-Saharan Africa. | |||
| Sanitation access rates more than doubled in low-income countries in the past 15 years. | FIGURE 2.17: Access to Sanitation Infrastructure in Sub-Saharan Africa, by Income: Total, Urban, and Rural Access Rates | ||
| a. Access to sanitation
| b. Urban access to sanitation
| a. Rural access to sanitation
| |
| Source: World Bank, World Development Indicators. Note: LIC = low-income countries; LMC = lower-middle-income countries; SSA = Sub-Saharan Africa; UMC = upper-middle-income countries. | |||
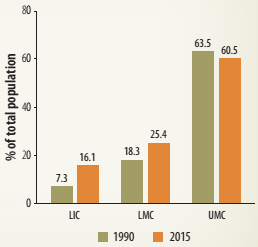
Overall access rates increased over the past 25 years for LICs and LMCs in Sub-Saharan Africa, and declined among UMCs. Again, these developments are primarily driven by the evolution of rural access rates. Across rural areas, access rates more than doubled among LICs (jumping from 7 percent in 1990 to 16 percent in 2015) (figure 2.17). Gains in access were significant, although not as high, in LMCs (they went from 18 percent in 1990, to 25 percent in 2015). Among UMCs, rural access rates declined, from 64 percent in 1990, to 61 percent in 2015. Finally, the rural access rate for UMCs is only higher than the regional median for South Asia.