Infrastructure Quantity
Telecommunications. The partial correlation results show a positive association between telecommunications density and real income per capita. This implies that, even after controlling for geographic and demographic factors, countries with greater income per capita tend to have a greater density of telecommunications. The analysis also finds that there has been a significant increase in telecommunications density among some countries in Sub-Saharan Africa over time.
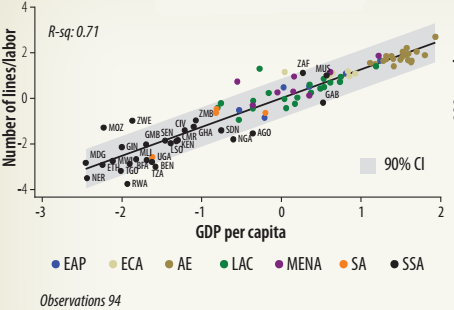
Given certain idiosyncratic features (say, demographic and geographic characteristics), some countries in the region perform above the international norm according to their level of development (as depicted by the regression line), while others remain below that norm. For 2008-12, South Africa and Mauritius register the highest extent of telecommunications density (as measured by the adjusted fixed and mobile lines per 1,000 people), and they are both above the international norm for that period (figure 2.18). However, some countries have similar levels of telecommunications density as that of South Africa but with lower levels of income per capita (say, Paraguay and Jordan), while other countries have similar levels of telecommunications density despite having higher levels of development (for example, Greece and Turkey).
A closer look at middle-income countries (MICs) in the region, other than South Africa and Mauritius, shows that most of these countries are below the international norm-especially Gabon, Nigeria, and Angola. This implies that, for their level of development, there is significant under-provision of telecommunications services in these countries. Most of the LICs in the region are along or below the international norm that characterizes the relationship between infrastructure and development. The weakest performers (as measured by the negative distance to the norm) are Rwanda and Tanzania. Finally, one of the most improved countries in the provision of telecommunications services is Ethiopia-a country that shifted from being one of the weakest performers in 1998-2002 to being at the international norm for its level of development in 2008-12. However, it has improved from a very low base, and it is still one of the most underachieving countries in the region.
| FIGURE 2.18: Telecommunications and Income per Capita, 2008-12 | ||
| a. Telecommunications density
| b. Internet density
| Some countries, like Kenya, Mauritius and South Africa, perform above the international norm according to their level of development. |
| Sources: International Telecommunications Union's World Telecommunication/ICT indicators; World Bank, World Development Indicators. GDP per capita is from Feenstra, Inklaar, and Timmer 2015. Note: CI = confidence interval, using PWT 9.0, adjusted by demographic and geographic features; EAP = East Asia and the Pacific; ECA = Europe and Central Asia; GDP = gross domestic product; AE = advanced economies; LAC = Latin America and the Caribbean; MENA = Middle East and North Africa; SA = South Asia; SSA = Sub-Saharan Africa. | ||
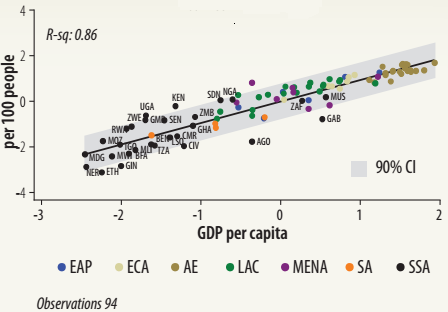
A positive conditional correlation between Internet density and income per capita is also observed, along with marked progress among countries in Sub-Saharan Africa over time-almost half the Sub-Saharan African countries in the sample are above the international norm in 2008-12. Nonetheless, the region still lags behind other developing countries with similar levels of economic development. For 2008-12, controlling for geographic and demographic variables, Mauritius, Nigeria, and Sudan show remarkable progress in Internet density (figure 2.18). Other MICs in the region (such as Gabon and Angola) have a level of Internet density that is significantly below their level of development. Kenya is significantly above the international norm and has experienced significant progress over the past decade. LICs in the region with significant under-provision of Internet services according to the international norm are Ethiopia, Guinea, and Côte d'lvoire.
Fixed broadband services, which is another quantity variable for telecommunications infrastructure, were only available in a few countries in Sub-Saharan Africa (only seven) in 1998-2002. With time, in 2008-12, more countries in Sub-Saharan Africa delivered fixed broadband subscriptions. In the latter period, Mauritius led all African countries; at the low end were Ethiopia, Malawi, and Guinea.
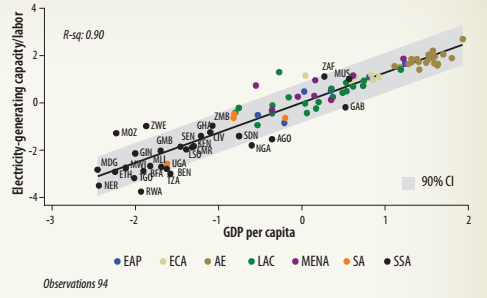
| There is progress in electricity-generating capacity in Ethiopia, while, Rwanda, Togo, and Tanzania continue to underperform. | FIGURE 2.19: Electricity-Generating Capacity and Income per Capita, 2008-12
Sources: International Energy Agency, World Energy Outlook. GDP per capita is from Feenstra, Inklaar, and Timmer 2015. Note: CI = confidence interval, using PWT 9.0, adjusted by demographic and geographic features; EAP = East Asia and the Pacific; ECA = Europe and Central Asia; GDP = gross domestic product; AE = advanced economies; LAC = Latin America and the Caribbean; MENA = Middle East and North Africa; SA = South Asia; SSA = Sub-Saharan Africa. | Power. There is a positive relationship between electricity-generating capacity and real income per capita across countries in the world. Hence, countries with greater income per capita tend to have larger electric power infrastructure stocks. For 2008-12, South Africa and Mauritius are the best performers in the region in power infrastructure quantity (after controlling for geography and demographics) (figure 2.19). Their adjusted levels of infrastructure provision are greater than those of countries with higher income per capita, like Hungary and Chile. Other MICs (for example, Gabon, Nigeria, and Angola) clearly underperform for their level of development. A closer look at low-income countries in the region shows sharp progress in electricity-generating capacity in Ethiopia over the past decade. By contrast, Rwanda, Togo, and Tanzania continue to underperform according to the international norm. |
| Ghana's road density is the best in the region. It is also significantly above the international norm. | FIGURE 2.20: Road Density and Income per Capita, 2008-12
Sources: International Road Federation, World Road Statistics; World Bank, World Development Indicators. GDP per capita is from Feenstra, Inklaar, and Timmer 2015. Note: CI = confidence interval, using PWT 9.0, adjusted by demographic and geographic features; EAP = East Asia and the Pacific; ECA = Europe and Central Asia; GDP = gross domestic product; AE = advanced economies; LAC = Latin America and the Caribbean; MENA = Middle East and North Africa; SA = South Asia; SSA = Sub-Saharan Africa. |
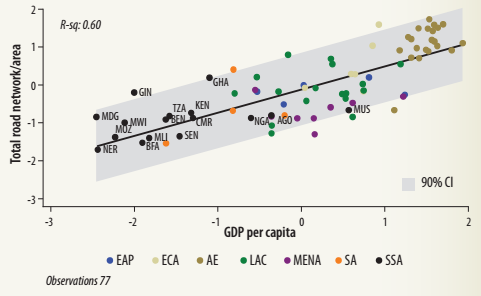
Transport. There is a positive partial correlation between real income per capita and road density in 2008-12 (figure 2.20). However, there appears to be a greater cross-country dispersion along the international norm when compared with infrastructure stocks in telecommunications and power. During this period, Ghana appears to be the best performing country in the region, with adjusted road density that is not only higher when compared with other countries in Sub-Saharan Africa, but also significantly above the international norm.6 Other countries with good performance in transport infrastructure quality include Guinea and Madagascar. Finally, most of the countries in the region lie close to or below the international norm for 2008-12.
Another important mode of transportation infrastructure is the railroad sector. The data on the length of the railroad network are not as complete as those on the road network. There is information available only for 74 countries for 1998-2002 and 65 countries for 2008-12. Still, there is a positive and significant relationship between income per capita and rail density. For 2008-12, South Africa continues to have the highest rail density in the continent, and its rail network remains over the international norm. The adjusted rail density is larger than those of countries with larger GDP per capita (for example, Chile and Malaysia, among others). By contrast, Côte d'lvoire, Cameroon, and Burkina Faso have underperformed relative to their level of income per capita, and also show the lowest density of railroads in the region.7
___________________________________________________________________________________________
6 South Africa did not have available information for this period.
7 Adding road and rail networks and assessing their performance as a whole would lead to similar results to those for the total road network. This analysis is not reported, but it is available from the team upon request.