Infrastructure Quality
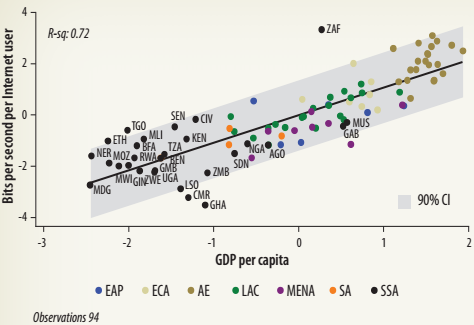
Telecommunications. Figure 2.21 depicts a positive relationship between international Internet bandwidth (in bits per second per Internet user) and real income per capita after controlling for demographic and geographic indicators. One finding that emerges from this analysis is that the partial correlation between Internet density and income per capita has increased over time (when comparing 1998-2002 vis-à-vis 2008-12), and most countries in Sub-Saharan Africa are above the international norm in the latter period.
| In 2008-12, South Africa registered an astounding increase in Internet density, thus becoming the best performer in the region and a significant over-provider of these services according to the country's level of development (figure 2.21) Other MICs in the region (for example, Gabon, Nigeria, Angola, and Sudan) are below the international norm. Finally, when looking at LICs in the region, Ghana, Cameroon, and Lesotho have levels of Internet infrastructure quality that are way below what the international norm predicts for their level of economic development. | FIGURE 2.21: Internet Traffic and Income per Capita, 2008-12
Sources: International Telecommunications Union's World Telecommunication/ICT indicators; World Bank, World Development Indicators. GDP per capita is from Feenstra, Inklaar, and Timmer 2015. Note: CI = confidence interval, using PWT 9.0, adjusted by demographic and geographic features; EAP = East Asia and the Pacific; ECA = Europe and Central Asia; GDP = gross domestic product; AE = advanced economies; LAC = Latin America and the Caribbean; MENA = Middle East and North Africa; SA = South Asia; SSA = Sub-Saharan Africa. | Internet density in South Africa is the best in the region, while Ghana, Cameroon, and Lesotho are way below countries with similar levels of development. |
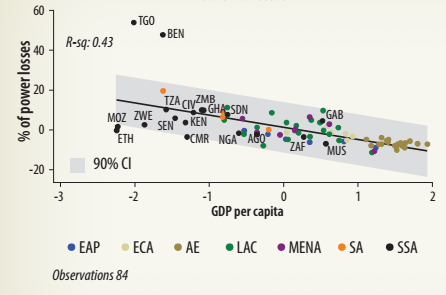
Power. The partial correlation analysis shows that countries with higher income per capita tend to have a lower percentage of power losses (that is, higher quality of electricity supply). For 2008-12, Mauritius, Cameroon, Ethiopia, and Mozambique are among the best performers in the region (with the lowest level of adjusted losses). All these countries overperform when compared with the predicted level of power losses according to the international norm (figure 2.22, panel a). Togo and Benin, by contrast, continue to underperform, with massive power losses.
| FIGURE 2.22: Power Quality and Income per Capita, 2008-12 | |
| a. Power losses
| b. WEF power quality
|
| Sources: World Bank, World Development Indicators; World Economic Forum, Global Competitiveness Report. GDP per capita is from Feenstra, Inklaar, and Timmer 2015. Note: CI = confidence interval, using PWT 9.0, adjusted by demographic and geographic features; EAP = East Asia and the Pacific; ECA = Europe and Central Asia; GDP = gross domestic product; AE = advanced economies; LAC = Latin America and the Caribbean; MENA = Middle East and North Africa; SA = South Asia; SSA = Sub-Saharan Africa; WEF = World Economic Forum | |
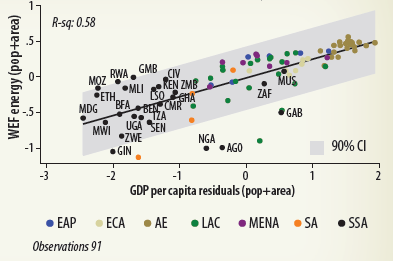
Benchmarking the quality of power infrastructure is complemented by the analysis of WEF perception measures of the quality of electricity supply. Figure 2.22, panel b, plots a positive partial correlation between income per capita and the perceived quality of power for 2008-12. For most MICs in Sub-Saharan Africa, the perceived quality of the power infrastructure sector is lower than what the international norm predicts for their level of income per capita. However, for some LICs, such as The Gambia, Côte d'Ivoire, and Rwanda, the perception of the quality of electricity supply is way above the level predicted by the international norm. Finally, Gabon, Nigeria, Angola, and Guinea have a level of power quality that is significantly below the one predicted by the international norm.
Transport. Benchmarking the quality of transport infrastructure involves assessing the performance of African countries on the hard and perceived measures of road and rail quality. Figure 2.23 depicts a positive relationship between the share of paved roads (a proxy for road quality) and income per capita for 2008-12. This implies that, after controlling for geographic and demographic factors, countries with higher income per capita tend to have a greater share of paved roads.
For 2008-12, Mauritius appears to be the leader in the share of paved roads (figure 2.23, panel a). The country's (adjusted) share of paved roads is close to the level predicted by the international norm, and it outperforms countries with greater levels of income per capita (for example, Poland). Tanzania, Cameroon, Kenya, and Ghana are the weakest performers in the region-with shares of paved roads that are significantly below those predicted by the international norm.
| FIGURE 2.23: Transport Quality and Income per Capita, 2008-12 | |
| a. Share of paved roads | b. WEF perception of road quality |
|
|
|
| Sources: International Road Federation, World Road Statistics; World Bank, World Development Indicators; World Economic Forum, Global Competitiveness Report. GDP per capita is from Feenstra, Inklaar, and Timmer 2015. Note: CI = confidence interval, using PWT 9.0, adjusted by demographic and geographic features; EAP = East Asia and the Pacific; ECA = Europe and Central Asia; GDP = gross domestic product; AE = advanced economies; LAC = Latin America and the Caribbean; MENA = Middle East and North Africa; SA = South Asia; SSA = Sub-Saharan Africa; WEF = World Economic Forum. | |
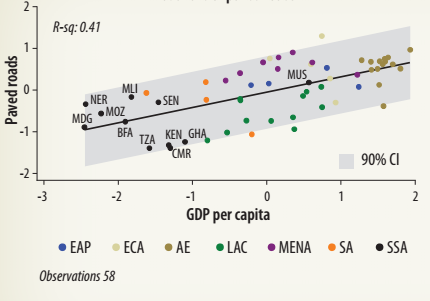
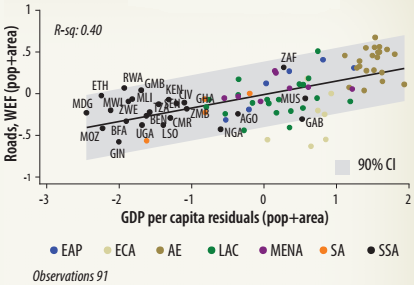
Figure 2.23, panel b, depicts the partial association between income per capita and the WEF perception of road quality during 2008-12. The figure confirms the findings of figure 2.23, panel a, that countries with higher income per capita tend to have better road quality. Perceived quality of the road network is the highest in South Africa (and above the international benchmark) for 2008-12-thus, outperforming countries in South America, like Brazil and Colombia. Other MICs in the region (for instance, Nigeria and Gabon) clearly underperform for their level of income per capita. Among LICs in the region, Guinea appears to have the lowest level of road quality, whereas the quality of roads in Rwanda and Ethiopia is far better than the one predicted by the international norm.
Railroad quality also exhibits a direct and positive relationship with income per capita after controlling for demographic and geographic indicators. The perception of railroad quality is the highest in Gabon, closely followed by South Africa. Among MICs in the region, the perception of rail quality in Nigeria and Angola is lower than that predicted by the international norm. In the group of LICs in Sub-Saharan Africa, Uganda exhibits the largest distance to the international norm.