Infrastructure Access
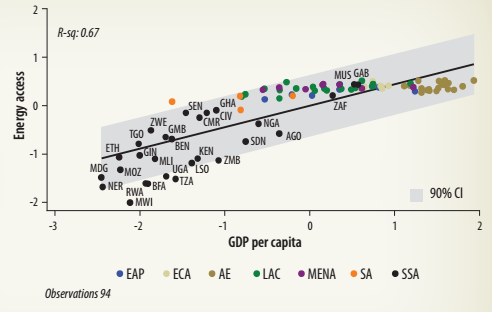
Electricity. Countries with greater income per capita tend to provide greater access to electricity. This finding holds after controlling for geography and demography (figure 2.24). For 1998-2012, the countries with the highest rates of access to electricity are Gabon and Mauritius-with adjusted rates that are higher than those of countries with similar income per capita (for example, Brazil and Mexico). Several LICs in this period have weak performance when compared with the international norm, namely, Malawi, Rwanda, and Lesotho. Over 2008-12, Gabon and Mauritius continued to display higher rates of access in the region. South Africa moved closer to the international norm. There was improvement over time in Rwanda and Tanzania, and Malawi remained the weakest performer in electricity access.
| Gabon, Mauritius, and South Africa remain the best performing countries in the region when measuring access to improved electricity sources. | FIGURE 2.24: Access to Electricity and Income per Capita, 2008-12
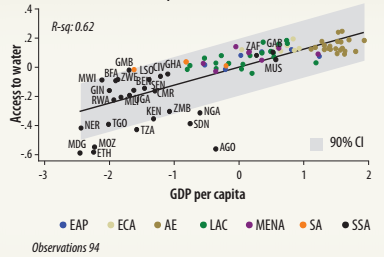
Sources: World Bank, World Development Indicators. GDP per capita is from Feenstra, Inklaar, and Timmer 2015. Note: CI = confidence interval, using PWT 9.0, adjusted by demographic and geographic features; EAP = East Asia and the Pacific; ECA = Europe and Central Asia; GDP = gross domestic product; AE = advanced economies; LAC = Latin America and the Caribbean; MENA = Middle East and North Africa; SA = South Asia; SSA = Sub-Saharan Africa. | Access to improved water sources. Figure, 2.25, panel a, plots the conditional correlation between income per capita and access to safe water in 2008-12. For this period, Gabon, Mauritius, and South Africa remain the best performing countries in Sub-Saharan Africa in access rates to water, and these rates are either similar or slightly above the ones predicted by the international norm.
|
MICs in the region, such as Sudan, Nigeria, and Angola, have access rates that are significantly lower than those predicted by the benchmarking exercise. The same holds for Madagascar and Ethiopia (both countries continue to underperform) among LICs.
Recent figures show that Ethiopia has made good progress in terms of extending access to water services. In urban areas, 93 percent of households now have access to an improved source of drinking water. Yet only 57 percent have access to water nationwide-in line with the Millennium Development Goals target.
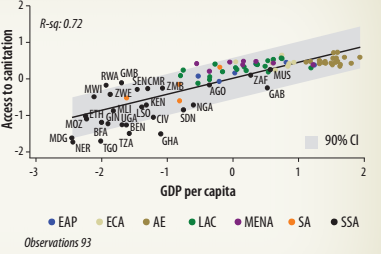
Access to improved sanitation facilities. Countries with greater income per capita also tend to have greater rates of access to improved sanitation facilities. For 2008-12, Mauritius and South Africa remain along the international norm, while Gabon appears to have fallen off track (figure 2.25, panel b). Over the past decade, Ethiopia moved from being the weakest performer to being close to the access rates predicted by the international norm. Niger, Togo, and Tanzania continue to have the lowest adjusted rates of access in the region.
| On this measure, Gabon appears to have fallen off track, while progress in Ethiopia has been significant. | FIGURE 2.25: Access to Water and Sanitation and Income per Capita, 2008-12 | |
| a. Improved water source
| b. Improved sanitation facilities
| |
| Sources: World Bank, World Development Indicators. GDP per capita is from Feenstra, Inklaar, and Timmer 2015. Note: CI = confidence interval; Using PWT 9.0; Adjusted by demographic and geographic features; EAP = East Asia and the Pacific; ECA = Europe and Central Asia; GDP = gross domestic product; AE = Advanced economies; LAC = Latin America and the Caribbean; MENA = Middle East and North Africa; SA = South Asia; SSA = Sub-Saharan Africa.. | ||