Closing the Infrastructure Quantity and Quality Gap Relative to the World Median (Excluding Sub-Saharan Africa)
Figure 2.26 depicts the growth benefits of closing the gap in terms of quantity and quality of infrastructure relative to the median of the world (excluding Sub-Saharan Africa) for each infrastructure sector.9 For instance, growth in GDP per capita for the region would increase by 1.7 percentage points per year if it were to close the gap with the regional median of each infrastructure indicator.
| Narrowing the quantity gap would deliver growth per capita that is 1.2 percentage points higher per year, while catching up in quality brings about growth that is 0.5 percentage point higher per year. For the quantity of infrastructure, the largest growth benefits are obtained by narrowing the gap in electric power (0.7 percentage point higher per year). For quality, improving road quality provides the largest benefits. | FIGURE 2.26: Growth Benefits of Narrowing the Gap vis-à-vis the World Median in Infrastructure (% points per year)
Sources: World Bank staff. Note: The coefficient estimates are taken from column [3] in Table 2.3 (Calderon and Serven 2010). K = Quantity; LICs = low-income countries; LMCs = lower-middle-income countries; Q = Quality; SSA = Sub-Saharan Africa; UMCs = upper-middle-income countries | Growth per capita for the region would increase by 1.7% per year by closing the infrastructure gap. |
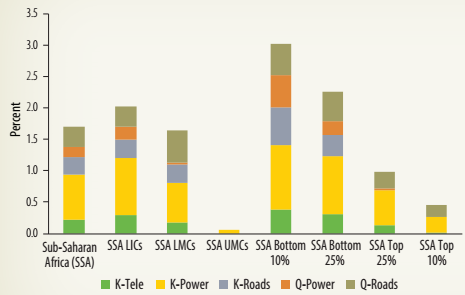
The results for the region reflect the infrastructure gaps observed in LICs and LMCs. The distance to the benchmark (and, hence, the growth effect) is greater for LICs in electric power installed capacity; it is greater for quality of roads among LMCs. UMCs in the region only trail the world median in electric power installed capacity. The gap is narrow and so are the growth benefits (about 0.05 percentage point per year). Narrowing the infrastructure gap among the worst performers in the region (the bottom 10 percent) improves growth per capita by 3 percentage points per year (2 percentage points attributed to closing quantity gaps), while it is only about 0.5 percentage point per year (0.2 percentage point attributed to closing quality gaps) for the best performers (the top 10 percent).
| Figure 2.27 depicts the second scenario of countries in the region closing the infrastructure gap relative to the best performers in the world-the latter being proxied by the top decile of the distribution of infrastructure stocks and quality. For the region, closing the quantity and quality of the infrastructure gap renders higher growth rates per capita of about 1.8 and 0.8 percentage points per year, respectively. This amounts to greater growth per capita of 2.6 percentage points per year. The largest growth potential benefits come from closing the gap in electric power-generating capacity and the length of the road network. | FIGURE 2.27: Growth Benefits of Narrowing the Gap vis-à-vis the World's Top Decile in Infrastructure (% points per year)
| Closing the infrastructure gap with the best performers in the world would translate into an increase of 2.6% in the region's per capita growth. |
| Sources: World Bank staff. Note: K = Quantity; LICs = low-income countries; LMCs = lower-middle-income countries; Q = Quality; SSA = Sub-Saharan Africa; UMCs = upper-middle-income countries | ||
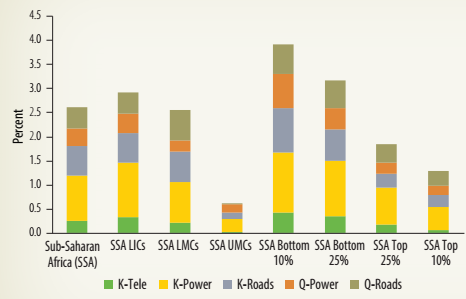
The growth benefits for the region are directly related to the potential gains of narrowing the gap for LICs and LMCs in the region. Energy appears to be a more binding constraint among LICs, whereas roads are the most binding constraint among LMCs-in quantity and quality. The growth rate of the worst performer in the region (bottom 10 percent) would be 3.9 percentage points higher per year, if it were to close its infrastructure gap with the top decile of the world distribution. About two-thirds of these potential growth gains are attributed to closing the gap in quantity. For the best performers in the region, growth per capita might increase by 1.3 percentage points per year in this scenario (with 0.8 percentage point attributed to closing the quantity gap). Even for the top performers, the sectors with the greatest potential contributions to growth are electric power and roads.
Although the focus is on supply-side issues for infrastructure, the demand side also requires consideration. This is especially the case for electricity. Box 2.4 shows that, in the case of electricity, there are important drivers of lower demand (lower uptake) among countries in Sub-Saharan Africa.
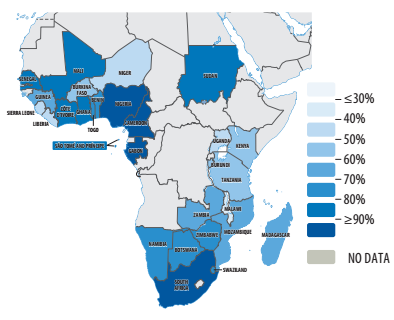
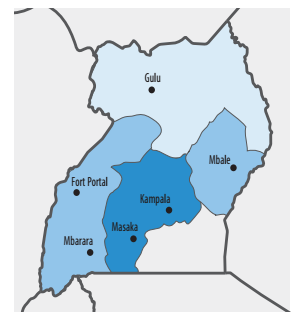
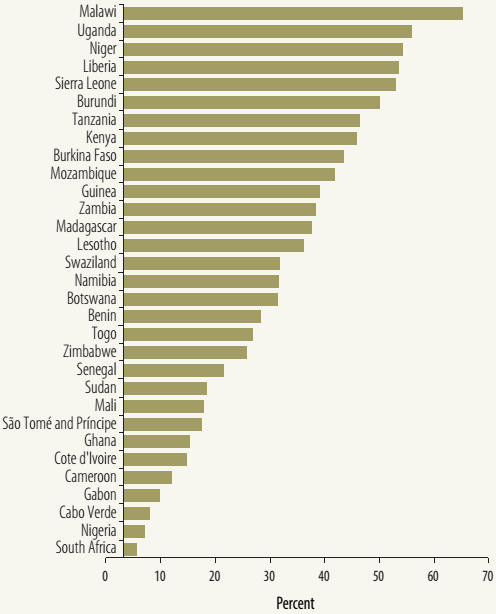
| BOX 2.4: To Achieve Universal Access to Electricity, More Needs to Be Understood on the Demand Side | Access to Electricity About one-third of the population in Sub-Saharan Africa has access to electricity, although various estimates indicate that a larger share of the population lives under the grid-ranging from 61 percent (Demographic and Health Surveys data) to 78 percent (Afrobarometer). Take-up rates are high in a few countries (South Africa, Nigeria, Gabon, and Cameroon), and they are very low and often below 50 percent in other countries (Malawi, Liberia, Uganda, Niger, and Sierra Leone) (map B2.4.1). There is also within-country variation in take-up rates, with a high concentration around big cities and urban centers. For instance, only the central region of Uganda, which includes the capital, Kampala, has a take-up rate that exceeds 50 percent. | |||
| MAP B2.4.1: Access Rate for Only the Households under the Grid | ||||
| a. Sub-Saharan Africa
| b. Uganda
| |||
| Note: Panel a shows take-up rates of electricity in 31 countries in Sub-Saharan Africa. The take-up rate is the share of households connected to the grid to households living under the grid. Panel b shows the take-up rate across regions in Uganda, which has a national access rate of 24 percent and take-up rate of only 45 percent. | ||||
| Low take-up is an important issue for understanding the demand side of electricity, especially given that most off-grid communities are rural and poorer-hence, ceteris paribus, take-up rates would be even lower in such areas if they were covered. This situation underscores the need for a deeper understanding of the constraints on the demand side and the incentives for take-up. To make electricity expansion financially viable and incentivize private sector participation in the sector, take-up rates need to be higher. | ||||
Some Findings on the Drivers of Take-Up across and within CountriesLow income levels in the region-especially in rural areas-hinder the capacity of households to afford a meaningful level of electricity consumption (Masami and Trimble 2016). Initial connection costs are excessively high relative to household income. Using granular data from western Kenya, Lee, Miguel, and Wolfram (2016) show that take-up rates are low and driven by expensive upfront connection charges. The authors also find that take-up increased significantly when connection charges were cut by more than half, albeit remaining relatively low. Some preliminary findings emerge from an ongoing study at the world Bank:a (1) Macro drivers. Cross-country variation in take-up rates is tightly linked to economic growth, urbanization, and governance. (2) Agriculture. A greater share of agriculture in gross domestic product is negatively associated with rates of electrification take-up. However, the modernization of agriculture (energy use for mills and irrigation) may foster some electricity expansion, which otherwise will not be financially viable due to insufficient demand (Banerjee and Malik 2016).
| FIGURE B2.4.1: Living Under the Grid but Not Taking Up
| |||
| (3) Household evidence. Not only the level of income, but also its flow and predictability have an impact on the ability of households to connect to electricity services. Hence, the creation and enhancement of income-generating activities would raise take-up and enable households (businesses), the government (through taxes), and the utilities (revenues) to overcome financial constraints. Improvement in this area implies providing credit facilities to bundle access to electricity with access to certain appliances, to foster economic activity. (4) High tariffs, high connection charges, and low household access are symptoms of underlying structural issues in the electricity market. The report will examine these issues by interacting the decision-making process of households, regulators, and utility companies.
a. The study on energy access in Sub-Saharan Africa is forthcoming in late 2017. For more information, please contact Moussa P. Blimpo and Malcolm Cosgrove-Davies. | ||||
___________________________________________________________________________________________
9 If the contribution is zero, there is no gap between the region (and/or subregion in Sub-Saharan Africa) and the benchmark.