Public Investment across Sub-Saharan Africa: Trends, Complementarities, and Cyclicality
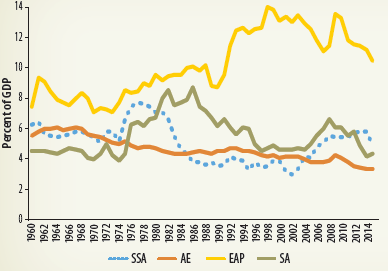
Public investment as a percentage of GDP in the region shows three marked periods: (a) a rising trend in the 1970s that reached a peak of about 7.8 percent in 1977-78, (b) a steady decline throughout the 1980s and stagnation in the 1990s that reached a trough of 3 percent of GDP in 2002, and (c) an increase in public investment that reached a peak of 5.8 percent of GDP in 2014. When comparing public investment across regions, East Asia and the Pacific outperforms all other regions, with levels of public capital spending that exceed 10 percent of GDP (figure 2.29)
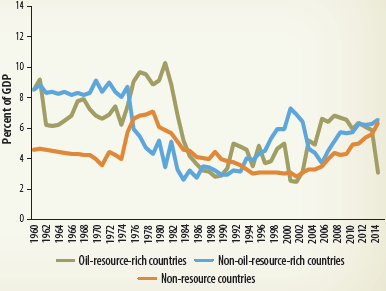
Focusing on averages for Sub-Saharan Africa masks the heterogeneity across country groups. Disaggregating the data by countries' resource abundance shows different trends and phases in public investment across country groups (figure 2.30). On average, in oil-rich countries, public investment has followed a rising path since the early 1990s. After reaching a peak of about 6.9 percent of GDP in 2006-08, public investment among oil-rich countries declined sharply, to 3.1 percent of GDP in 2015, partly due to lower commodity-based public revenues. For non-oil-resource-rich countries and non-resource countries, public investment has experienced a steady increase since 2006 (with a cumulative gain up to 2015 of about 2.8 and 2.9 percentage points of GDP, respectively).
| FIGURE 2.29: Public Investment, by Region 1960-2015 (%GDP) | FIGURE 2.30: Public Investment in Sub-Saharan Africa, by Group, 1960-2015 (%GDP) |
|
|
|
| Source: World Development Indicators, World Bank. Note: AE = advanced economies; EAP = East Asia and the Pacific; GDP = gross domestic; SA = south Asia; SSA = Sub-Saharan Africa. | Source: IMF Investment and Capital Stock Database. |
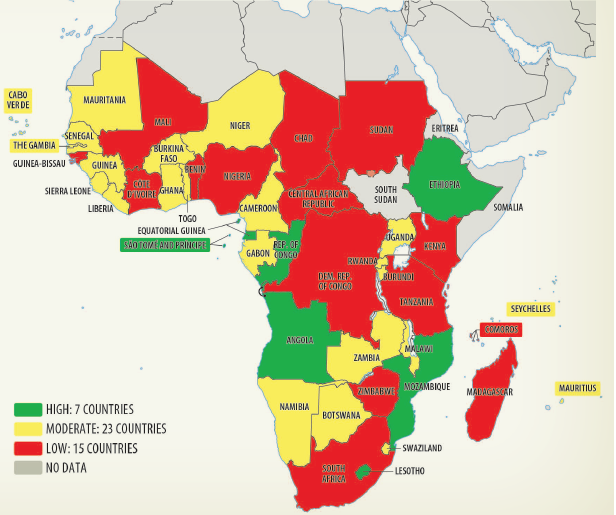
| Low-investment countries in the region have an average public investment of 3.1% of GDP. | MAP 2.1: Public Investment across countries in Sub-Saharan Africa (% GDP, average, 2011-15) | Map 2.1 depicts the cross-country heterogeneity in the distribution of public investment (as a percentage of GDP) in the Sub-Saharan Africa region. The figure classifies countries by their investment-output ratios as low (less than 5 percent of GDP), medium (between 5 and 10 percent of GDP), and high (more than 10 percent of GDP).11 Seven of 45 countries in the region have low investment, 23 have medium investment, and 15 have high investment. Low-investment countries in the region have an average public investment of 3.1 percent of GDP; medium-investment countries have an average of 6.8 percent; and high-investment countries have an average of 18.2 percent. The medium public investment group has the highest average private investment rate, at 15.1 percent of GDP, followed by the high and low public investment groups (12.4 and 10 percent, respectively). |
|
Source: IMF Investment and Capital Stock database. |
___________________________________________________________________________________________
11 The thresholds of 5 and 10 percent of GDP are similar to the bottom and top terciles of the distribution of investment-output ratios in the world for 2011-15.