Public Investment: Crowding-In or Crowding-Out Private Investment
The interaction between public and private investment remains a subject of controversy. Do public and private investment have different growth effects? If they both matter for growth, what are the possible links between them? If public investment crowds in, say, the participation of (domestic and/or foreign) private investors in transportation or energy projects, the relevant policy question becomes how to maximize the complementarities and prioritize public investment in sectors with high productivity and/or large positive spillover effects (for example, infrastructure). By contrast, if private investment is crowded out by public investment, the relevant policy question is what can be done to reduce this crowding-out effect, so that countries can reap more benefits from higher public investment (Cavallo and Daude 2011).
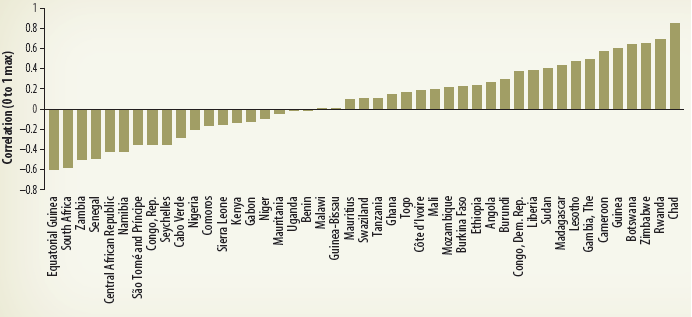
Figure 2.31 depicts the correlation between public and private investment ratios for 45 countries in the region over 1970-2015. The correlation ranges from -0.59 (Equatorial Guinea) to 0.85 (Chad), and the regional median (average) public-private investment correlation is 0.11 (0.08). Two findings emerge from this figure: first, 19 of 45 countries display a negative correlation between public and private investment, and the median correlation for these 19 countries is -0.275. Second, there is a positive association between private and public investment for 26 of 45 countries, and their median correlation is 0.282. In other words, the evidence suggests that public and private investment are substitutes in 19 countries, and complements in 26 countries. Although central measures of correlation do not appear to be large, there are countries where either the degree of substitutability is important (say, Equatorial Guinea, Zambia, South Africa, and Senegal) or the extent of complementarity (say, Botswana, Zimbabwe, Rwanda, and Chad).
| FIGURE 2.31: Public and Private Investment: Complements or Substitutes? | In Sub-Saharan Africa, public and private investment are substitutes in 19 countries, and complements in 26 countries. |
|
| |
| Source: IMF Investment and Capital Stock Database Note: The figure depicts the correlation between the private and public investment ratios to GDP during 1970-2015. These two ratios are expressed in first differences. |
|
To reduce the crowding-out effect of public investment on private investment or to foster crowding-in effects, there is the need to formulate policies that elevate the marginal product of capital or alleviate financial constraints (Aschauer 1989; Cavallo and Daude 2011). In this context, policies to foster institutional quality and/or enhance access to international credit markets will help to reduce the substitutability or increase the complementarity between private and public investment. The correlates of the degree of substitutability/complementarity between public and private investment and measures of institutional quality, financial openness, and financial development are examined.
Cavallo and Daude (2011) estimate the private investment equation for 116 countries for 1980 to 2006, using dynamic panel data techniques that address issues of unobserved components and reverse causality. On average, they find a negative effect of public investment on private investment in developing countries: a 1 percentage point increase in public investment (as a percentage of GDP) reduces private investment by 0.22 percentage points. This finding suggests that the crowding-out effects of public investment through weak public institutions or borrowing constraints tend to outweigh the crowding-in effects from the rising marginal product of private capital. 12 Raising the efficiency of public investment and improving the ability to crowd in private investment should be at the top of the policy agenda. In this context, efforts to improve institutions (at the country and project levels) and implement policies to alleviate borrowing constraints (say, creating fiscal space and fostering financial openness) are necessary.
Table 2.4 presents a simple analysis of the correlates of the interaction between private and public investment for three samples: developing countries, developing countries excluding Sub-Saharan Africa, and countries in Sub-Saharan Africa. 13 Some preliminary findings emerge from the table: (a) political stability and government effectiveness have a positive (although not statistically significant) association with the interaction between private and public investment among developing countries (excluding Sub-Saharan Africa); (b) developing domestic financial markets may help boost the effectiveness of public investment to crowd in private investment; (c) an analogous result to (b) is observed when foreign capital flows into developing countries (as captured by a widened current account deficit); and (d) the correlates are weak when the regression analysis is restricted to countries in Sub-Saharan Africa. In sum, alleviating borrowing constraints-through deepening local financial markets or fostering financial openness-is associated with rising complementarities between public and private investment.
TABLE 2.4: Correlates of Public-Private Investment Interactions
Dependent variable: Correlation between public and private investment, 1970-2015
|
| Political Stability | Government Effectiveness | Control of Corruption | ||||||
|
| Developing countries [1] | Dev. Countries excl. SSA [2] | SSA countries [3] | Developing countries [4] | Dev. Countries excl. SSA [5] | SSA countries [6] | Developing countries [7] | Dev. Countries excl. SSA [8] | SSA countries [9] |
| Governance | -0.0094 | 0.0513 | -0.1017 | -0.0155 | 0.0079 | -0.1218 | -0.0230 | -0.0067 | -0.1036 |
| (level) | (0.037) | (0.045) | (0.063) | (0.037) | (0.045) | (0.078) | (0.037) | (0.043) | (0.073) |
| Current account | -0.0114** | -0.0132** | -0.0092 | -0.0113** | -0.0129** | -0.0062 | -0.0112** | -0.0127** | -0.0070 |
| (% GDP) | (0.004) | (0.004) | (0.008) | (0.004) | (0.004) | (0.009) | (0.004) | (0.004) | (0.009) |
| Financial development | 0.0704** | 0.0796* | 0.0560 | 0.0694* | 0.0776* | 0.0204 | 0.0698** | 0.0771* | 0.0356 |
| (% GDP, logs) | (0.035) | (0.046) | (0.059) | (0.036) | (0.046) | (0.067) | (0.035) | (0.046) | (0.061) |
| Observations | 127 | 85 | 42 | 127 | 85 | 42 | 127 | 85 | 42 |
| R-squared | 0.073 | 0.111 | 0.099 | 0.073 | 0.098 | 0.0681 | 0.075 | 0.098 | 0.0561 |
Note: * (**) denotes significance at the 10 (5) percent level. The correlation is computed after expressing both variables in first differences.
___________________________________________________________________________________________
12 The empirical findings of Cavallo and Daude (2011) are consistent with those of Blejer and Khan (1984) and Everhart and Sumlinski (2001). The latter two papers use a smaller sample of countries and earlier sample periods.
13 This regression analysis captures associations at the cross-sectional level rather than causality. The analysis is not as exhaustive as the one presented in Cavallo and Daude (2011).