Public Investment along the Business Cycle in Sub-Saharan Africa
Fiscal policy in developing countries tends to be procyclical. Governments typically cut taxes and increase spending during booms, and retrench outlays-especially capital expenditure-and implement tax hikes during busts (Kaminsky, Reinhart, and Végh 2004). In the literature, this destabilizing policy behavior has been attributed to the limited access to (external) funding for policy actions or political economy distortions.
Historically, fiscal policy has behaved pro-cyclically among countries in Sub-Saharan Africa (Thornton 2008; Lledó, Yackovlev, and Gadenne 2011). The degree of procyclicality has been not only greater than that of other developing countries, but also higher in the 1980s and 1990s (Lledó, Yackovlev, and Gadenne 2011). Greater foreign aid inflows and fiscal space have played an important role in reducing the degree of fiscal policy pro-cyclicality among countries in the region.
Figure 2.32 depicts the correlation between the cyclical components of the ratio of public investment to GDP and the level of output across 45 countries in Sub-Saharan Africa for 1970-2015: 26 of the 45 countries exhibit a negative correlation between public investment and the level of economic activity, while 19 countries show a positive association. For those countries with a countercyclical relationship between public investment and the level of economic activity, the median correlation is about -0.12 (South Africa). The countries with the largest negative correlation (exceeding -0.25) are The Gambia, Mauritius, Burkina Faso, Lesotho, Swaziland, and Sierra Leone. The median correlation for the countries with a procyclical relationship between public investment and the level of economic activity is 0.14 (Côte d'lvoire). The countries with the largest positive correlation (exceeding 0.35) are Sudan, Madagascar, Rwanda, Gabon, and the Central African Republic.
FIGURE 2.32: Cyclical Behavior of Public Investment across Sub-Saharan African Countries |
|
Source: World Development Indicators, World Bank. |
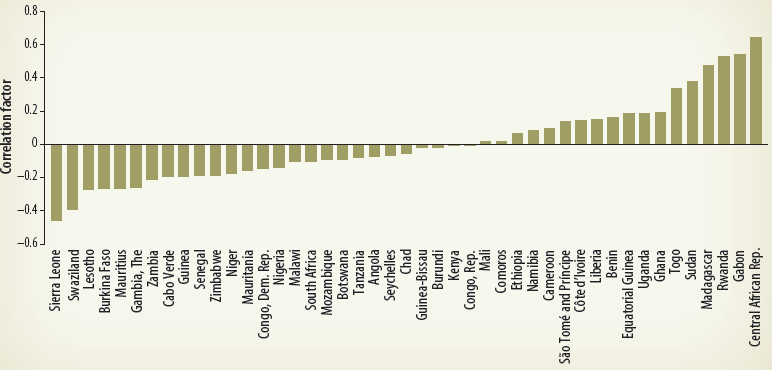
Table 2.5 looks at the correlates of the extent of cyclicality of public investment on the level of institutional quality, amount of external financing (as proxied by the current account balance as a percentage of GDP), and depth of local financial markets. The regression estimates show that:
(a) Public spending tends to be less procyclical or more countercyclical in countries with stronger institutions. It has been argued in the literature that public investment tends to be higher and more procyclical in countries with bad institutions. This reflects the enhanced rent-seeking incentives of governments in environments with insecure property rights (Keefer and Knack 2007; Alesina, Campante, and Tabellini 2008) and/or environments with common pool problems (Tornell and Lane 1999). 14
(b) Public spending is more procyclical in countries with more inflows of foreign capital (that is, when the current account is in deficit). This finding is attributed to the fact that developing countries are unable to borrow in bad times-as these countries have procyclical access to global capital markets (Gavin and Perotti 1997; Catao and Sutton 2002).
In sum, stronger institutions supporting macroeconomic policies tend to be related to a lower extent of pro-cyclicality (and even counter-cyclicality) of capital spending. Access to global financial markets, by contrast, contributes to a larger degree of pro-cyclicality. These findings are consistent with those of Calderon and Nguyen (2016).
TABLE 2.5: Cyclical Behavior of Public Investment
Dependent variable: Correlation of the cyclical components of public investment and real output, 1970-2015
Explantory variables | (1) | (2) | (3) |
Governance (level) | -0.0302*** (-0.00985) | -0.0229** (-0.00983) | -0.0312** (-0.0137) |
Current account (% GDP) |
| -0.00722*** (-0.00242) | -0.00742*** (-0.00243) |
Financial development (% GDP, logs) |
|
| 0.0295 (-0.0415) |
Constant | 0.0379* (-0.0205) | 0.0155 (-0.0234) | -0.0854 (-0.149) |
Observations | 169 | 166 | 166 |
R-squared | 0.062 | 0.095 | 0.098 |
Note: * (**) [***] denotes significance at the 10 (5) [1] percent level.
___________________________________________________________________________________________
14 Analogously, public health and education spending has a positive and significant impact on child mortality and education failure rates only in countries with good governance (Rajkumar and Swaroop 2008).