Current Spending Levels Are Too Low to Address Infrastructure Needs
A summary of the stylized facts of capital spending in infrastructure for the sample of 24 countries in Sub-Saharan Africa across the main infrastructure subsectors-roads, water, air transport, electricity, telecommunications, and water and sanitation-for 2009-15 is presented below. The sample accounts for about 70 percent of the regional GDP, and is compared with five countries from other regions, namely, Albania, Guatemala, Moldova, Peru, and Tunisia. The list of countries in the sample along with basic indicators on data quality is presented in annex 2b.
| On average, the 24 countries in Sub-Saharan Africa in the sample have spent around 2 percent of GDP annually between 2009 and 2015 to build, rehabilitate, or improve the existing capacity of infrastructure across the main subsectors. Roads accounted for two-thirds of overall investments. Capital spending on electricity and water supply and sanitation each accounted for 15 percent of total capital expenditures (figure 2.33). Overall, actual spending on infrastructure was considerably lower than capital allocations during the same period, amounting to around 3.4 percent of GDP, reflecting substantial under-execution of such investments. | FIGURE 2.33: Sectoral Distribution of Capital Spending | Expenditures on infrastructure are considerably lower than allocations, amounting to just 2% of GDP. |
|
| ||
| Source: World Bank, BOOST data, staff calculations. |
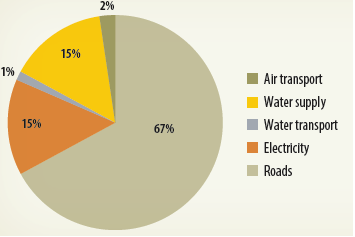
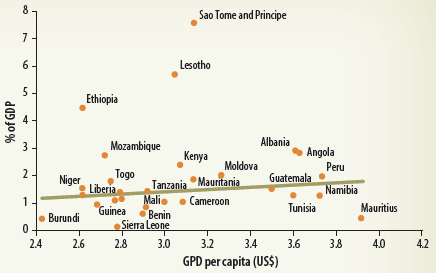
Figure 2.34 shows that there is a positive relationship between capital spending and income per capita; that is, wealthier countries tend to investment more on average-although with notable exceptions. For instance, São Tomé and Príncipe, Lesotho, and Ethiopia exhibited high spending levels during the period, despite low per capita income levels, while Namibia underspent vis-a-vis the expected threshold for its income level.
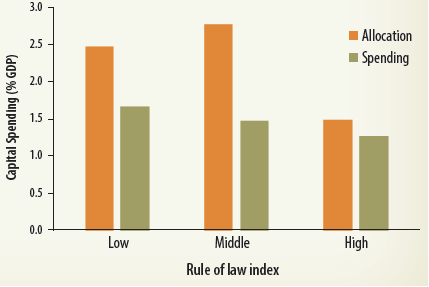
The quality of governance and institutional capacity has a dual impact on the size of capital spending. On one hand, the overall size of infrastructure capital allocations tend to be larger among countries with low to moderate institutional quality as measured by the Worldwide Governance Indicators (WGI).This is consistent with the notion that countries with lower levels of governance might allocate more on infrastructure due to greater rent-seeking behavior, lack of technical capacity to prepare projects, among other things (figure 2.35). On the other hand, under-execution rates (as measured by the gap between capital allocation and spending) are more pervasive in countries with low to moderate levels of governance effectively reducing the size of actual capital spending (figures 2.35 and 2.40). This finding is consistent with the prevailing notion that countries with good governance tend to exhibit higher growth rates in the long run, as a result of higher efficiency, quality and effectiveness of infrastructure investments.
| Overall, capital spending appears insufficient to cover basic needs. | FIGURE 2.34: Capital Spending in Infrastructure versus GDP, 2009-15
Source: World Bank, BOOST data, staff calculations. | The amounts of capital spending appear to be insufficient compared with overall needs.15 Several top-down approaches have estimated that global infrastructure needs throughout the developing world require sustained levels of spending of over 6 percent of GDP annually.16 Other studies have estimated global infrastructure needs to be equivalent to slightly below 4 percent (OECD 2006; McKinsey 2016). Although no exact measurement of infrastructure gaps exists, with estimates being sensitive to applied methodologies, available empirical studies suggest that current levels of spending are not sufficient to address the acute shortfalls suffered by populations in Africa, a region that typically lags behind global averages in the stock and quality of infrastructure.
|
| FIGURE 2.35: Capital Allocation, Capital Spending and the Rule of Law
Source: World Bank, BOOST data, staff calculations. |
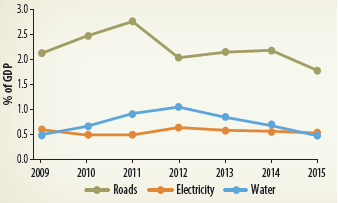
Furthermore, trend analysis suggests that general government capital allocations have stagnated over the past seven years, especially in the three main subsectors. Total capital budget allocations in roads has been decreasing after reaching a peak of 2.6 percent of GDP in 2011 (figure 2.36). Similarly, capital allocations for water supply and sanitation have reverted to 2009 levels, after experiencing a surge between 2009 and 2012, during which they reached 1 percent of GDP. Electricity allocations have remained stable, at around 0.5 percent of GDP, with increasing reliance on externally funded investment projects and limited domestic revenue mobilization toward this sector.
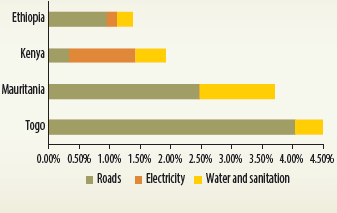
However, there are significant differences among the Sub-Saharan African countries in the sample. For capital budget allocation, countries like Togo, Mauritania, and Kenya experienced large increases of 3 percent or more between 2009 and 2015, driven mostly by allocation increases in roads (figure 2.37) On the other side of the spectrum, São Tomé and Príncipe, Lesotho, Angola, and Benin recorded the largest percentage decreases in public capital allocations in infrastructure from 2009 levels Although São Tomé and Príncipe, Lesotho, and Angola continue to experience large levels overall (5.6, 4.2, and 4.5 percent of GDP, respectively), the slowing pace of capital allocations in Benin-driven mostly by roads and water and sanitation-is more problematic in light of lower spending levels overall and acute infrastructure gaps.
| FIGURE 2.36: Evolution of Capital Budget Allocation | FIGURE 2.37: Drivers of Spending Allocation Increases | General government capital allocations have stagnated in these three sectors. |
|
|
| |
| Source: World Bank, BOOST data, staff calculations. |
___________________________________________________________________________________________
15 The infrastructure spending cited above does not incorporate capital spending potentially undertaken by state-owned enterprises, and does not always capture the entirety of foreign funded capital spending that stays off budget.
16 See Fay and Yepes (2003), Bhattacharya, Romani, and Stern 2012, and Fay et al. (2011).