High Concentration in the Top Four Countries in the Region
PPP projects in Sub-Saharan Africa have been concentrated in only a few countries, namely South Africa, Nigeria, Kenya, and Uganda, which are the top four countries in investment and number of projects. Together they account for 48 percent of the 335 total PPP projects in the region in the past 25 years.22 This amounts to $36.7 billion of investment commitments, or 62 percent of the $59 billion of total investment commitments in the region.23
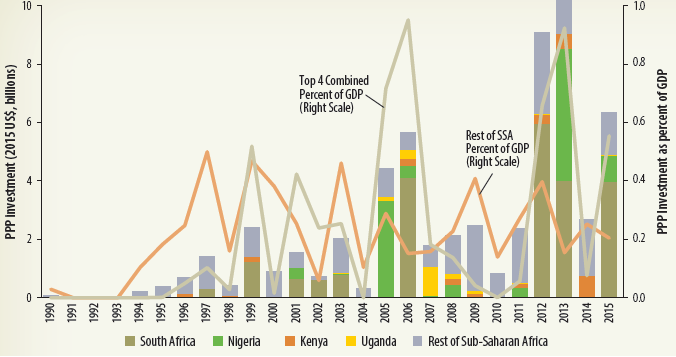
Looking at PPP investment over the years also demonstrates the role these four countries have played in the region's PPP market. Investment as a percentage of GDP tends to be somewhat sporadic for the top four countries, jumping during boom years, such as 2005-06, 2012-13, and 2015 (figure 2.43). In three of the past five years, the top four countries (especially South Africa and Nigeria) have played a significant role in the development of Sub-Saharan Africa's PPPs. This has been largely due to renewable energy initiatives in South Africa and port renovations in Nigeria.
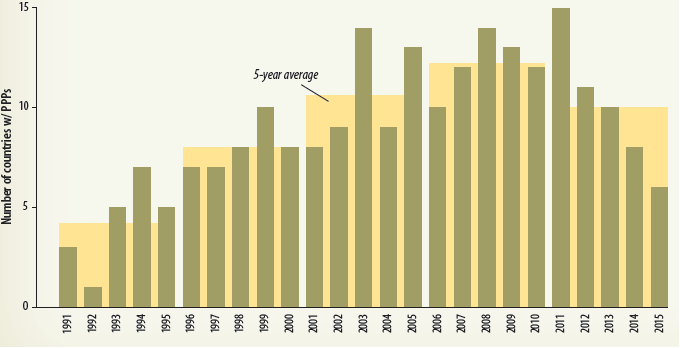
Another way to assess at the concentration of PPPs is to look at the number of countries per year that had new PPP investment commitments. The number of countries gradually increased in the 1990s and early 2000s, peaking during the latter 2000s (figure 2.44). The first half of the 2010s has subsequently seen a falloff in the number of countries with new PPP commitments. Looking at the annual number of PPPs per country (countries with at least one PPP) shows that averages have increased slightly in recent years, reflecting a surge of 19 port projects in Nigeria in 2005, and the large number of renewable energy projects in South Africa-31 in 2012, 12 in 2013, and 16 in 2015.
| FIGURE 2.43: PPP Investment in Top Four Countries versus the Rest of Sub-Saharan Africa | PPP projects in Sub-Saharan Africa have been Concentrated mainly in Kenya, Nigeria, South Africa, and Uganda. |
|
Source: World Bank PPI Database - 7 Feb 2017 *Note: % of GDP for rest of EMDE uses GDP for all countries except Sub-Saharan Africa. Data excludes telecom, divestitures, merchants, and management and lease contracts. | |
| FIGURE 2.44: Annual Number of Countries with PPP Projects Sub-Saharan Africa (1991-2015) | The number of countries per year that had new PPP investment commitments has increased slightly in recent years |
|
Source: World Bank PPI Database, February 7, 2017. *Note: Data exclude telecom, divestitures, and merchants |
___________________________________________________________________________________________
22 Projects that cross borders are counted only once, and this count only represents each country's portion of those projects divided evenly between the participating countries. For example, for the Belt Bridge Border Post project between South Africa and Zimbabwe, only half of the project is represented by the top four countries. Another example is the West African Gas Pipeline, which is split among Togo, Ghana, Benin, and Nigeria. The top four countries account for only one-quarter of this project.
23 The same information about cross-border projects applies to these investment sums. Total investment is divided among countries participating in cross-border projects, and then only applied to their category of aggregation. For example, only one-quarter of the total investment for the West African Gas Pipeline is attributed to Nigeria's aggregated investment.