Project Type and Sector
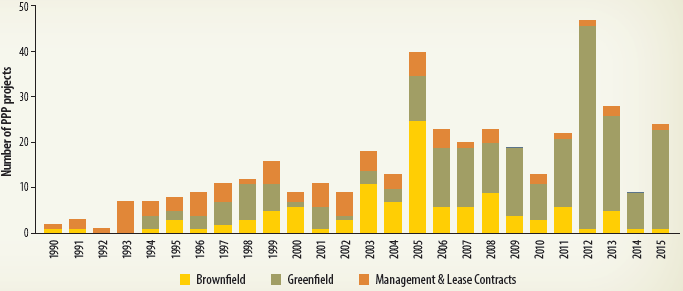
The PPI database identifies three types of PPP projects: management and lease contracts, greenfield projects, and brownfield projects. In the 1990s, as PPPs started to gain traction, management and lease contracts were the predominant type of PPP, likely due to their relative simplicity and ease of implementation. Brownfield projects gained popularity in the mid-1990s, peaking in 2005 and then subsequently declining, probably as existing assets that were eligible for PPPs were exhausted. Greenfield projects exhibit continued growth, as emphasis has been placed on renewable energy projects, which are largely responsible for the increase in greenfield projects in the most recent years, and particularly in 2012 (figure 2.45).
| The number of greenfield projects has grown steadily, reflecting the emphasis on renewable energy. | FIGURE 2.45: Number of PPP Projects by Type of Project, Sub-Saharan Africa
Source: World Bank PPI Database, February 7, 2017. Note: Data exclude telecom, divestitures, and merchants. |
A look at the number of projects in Sub-Saharan Africa broken down by sector demonstrates the increasing dominance of energy PPP projects, which have overshadowed the transport and water and sanitation sectors in recent years. The large presence of transport projects in 2005, 23 in total, was due to a boom of 19 transport projects in Nigeria, all projects to rehabilitate and expand seven ports in four major cities. This was part of a broad Nigerian initiative to attract private participation in the port sector.
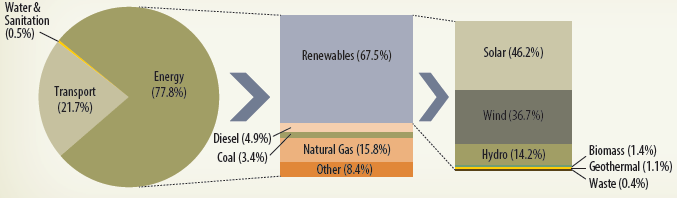
The PPP infrastructure projects in Sub-Saharan Africa in the past five years have mainly been concentrated in the energy sector (78 percent), followed by transport (22 percent) and water and sanitation (0.5 percent) (figure 2.46) Among the energy projects, the majority are renewable energy projects (68 percent), distributed across solar (46 percent), wind (37 percent), and hydro (14 percent). The solar projects are concentrated almost entirely in South Africa, which produced 35 of the 37 projects between 2012 and 2015. Total PPP investment in solar is $7.6 billion (2015 US$). Wind power is slightly less concentrated, but South Africa is still the dominant player, producing 23 of 28 total projects, worth $4.9 billion (80 percent) of the $6.1 billion total investment commitments in wind projects. The five remaining projects were undertaken by Kenya (two), Cabo Verde, Ethiopia, and Mauritius. The largest project by investment commitment is the Aldwych Lake Turkana Wind Farm in Kenya, worth $765 million. The next largest project is worth $506 million (South Africa), and the average wind project in Sub-Saharan Africa is worth $219 million.
The increase in recent years in greenfield and energy projects is in part due to the increasing emphasis on renewable energy projects, which have expanded rapidly. A large boom in 2012 was mainly due to a surge in solar and wind projects in South Africa. In total, South Africa had 31 greenfield energy projects in 2012, worth a combined $5.9 billion: $4.24 billion in solar (23 projects) and $1.65 billion in wind (eight projects) These two categories made up the extent of PPP projects in South Africa for 2012. In 2013 (four solar, seven wind) and 2015 (eight solar, seven wind), the number of renewable projects in South Africa was lower but still significant.
| FIGURE 2.46: Breakdown of PPP Projects in the Energy Sector, Sub-Saharan Africa (2011-15)
Source: World Bank PPI Database, February 7, 2017. *Note: Each category makes up 100%. Data exclude telecom, divestitures, and merchants. | PPP infrastructure projects in the region have concentrated mainly in the energy sector (78%). |