Public Investment Management
The efficiency of public investment is closely tied to the quality of institutions at the country and project levels. Rajaram et al. (2014) identify several institutional features that countries need to adopt to deliver growth-enhancing public investment. Their findings imply the need for the following: (a) implementation of a transparent and accountable system for guiding, appraising, reviewing, and selecting projects that will enhance inclusive growth; and (b) design mechanisms and procedures to implement, adjust, operate, and evaluate projects to optimize public service delivery. Weaknesses in any of these areas may lead to poor investment and lower growth.
Fostering development through public investment requires strengthening institutions for public investment management.41 Dabla-Norris and associates (2012) constructed an index that evaluates the underlying institutional features of the Public Investment Management Index (PIMI), for 71 developing countries from 2007 to 2010 across four stages: project appraisal, selection, implementation, and evaluation. Scores for this index range from 1 to 4, with higher scores denoting better performance-that is, best (worst) performing PIMs are described by a score of 4 (1).
| The region's overall score (1.53) lags behind that of East Asia (1.59) and Latin America (1.84). | FIGURE 2.52: Public Investment Management Index, by Region
Source: Dabla-Norris, Brumby, Kyobe, Mills, and Papageorgiou (2012) Note: EAP = East Asia and the Pacific; LAC = Latin America and the Caribbean; SSA = Sub-Saharan Africa. | Figure 2.52 displays the averages for the categories that comprise the overall PIMI score in three regions (Sub-Saharan Africa, Latin America and the Caribbean, and East Asia and the Pacific). |
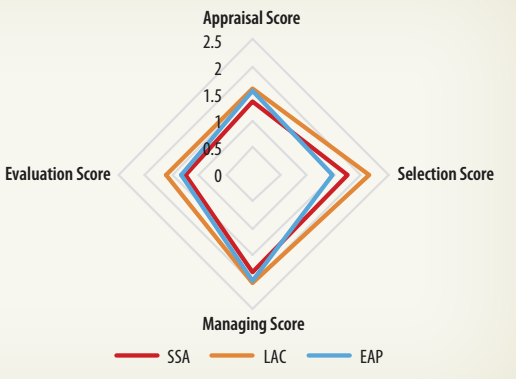
The score for Sub-Saharan Africa (1.53) is behind those of East Asia and the Pacific (1.59) and Latin America and the Caribbean (1.84).42 The score on project selection for Sub-Saharan Africa outperforms East Asia and the Pacific, but not Latin America and the Caribbean. Sub-Saharan Africa trails in the other three subcategories (project appraisal, managing, and evaluation). The performance of public investment management within the region varies by income level.43 The highest average PIMI index is achieved by UMCs (2.07), followed by low-income countries (LICs) (1.45) and LMCs (1.33). Although LICs and UMCs have comparable scores in project managing, LICs are outperformed by the two other country groups in the areas of project appraisal and evaluation.
_____________________________________________________________________________________________
41 This implies enhanced practices of project appraisal, dealing with uncertainty, integration of procurement practices into project design and implementation, and managing the decision on PPPs.
42 The Sub-Saharan Africa sample comprises 32 countries: Benin, Botswana, Burkina Faso, Burundi, Chad, the Republic Congo, Côte d'Ivoire, Ethiopia, Gabon, The Gambia, Ghana, Guinea, Kenya, Lesotho, Madagascar, Malawi, Mali, Mauritania, Mozambique, Namibia, Nigeria, São Tomé and Príncipe, Rwanda, Senegal, Sierra Leone, South Africa, Sudan, Swaziland, Tanzania, Togo, Uganda, and Zambia. This figure also includes 10 countries in Latin America and the Caribbean (Barbados, Belize, Bolivia, Brazil, Colombia, El Salvador, Haiti, Jamaica, Peru, and Trinidad and Tobago) and seven countries in East Asia and the Pacific (Cambodia, Indonesia, the Lao People's Democratic Republic, Mongolia, the Philippines, Solomon Islands, and Thailand).
43 Classifying countries in the region by income renders the following: 21 LICs (Benin, Burkina Faso, Burundi, Chad, the Republic of Congo, Ethiopia, The Gambia, Ghana, Guinea, Kenya, Madagascar, Malawi, Mali, Mozambique, Rwanda, Senegal, Sierra Leone, Tanzania, Togo, Uganda, and Zambia), six LMCs (Côte d'Ivoire, Lesotho, Nigeria, São Tomé and Príncipe, Sudan, and Swaziland), and five UMCs (Botswana, Gabon, Mauritania, Namibia, and South Africa).