Public Investment Management and Economic Performance
Weak institutions tend to distort the effectiveness of public investment, thus limiting its impact on growth (Cavallo and Daude 2011). In other words, one dollar invested by the public sector in an economy with high levels of rent-seeking and corruption renders a smaller amount of public services compared with an economy with good institutions. This subsection looks at the association between the institutions governing public investment management (as proxied by the PIMI index) and economic performance, namely, growth per capita, investment (public and private), and efficiency of investment.
Plotting the overall PIMI index vis-à-vis growth per capita for a sample of countries across the world shows that there is a positive relationship between these two variables. That is, countries with stronger public investment management tend to have higher per capita growth rates. Some interesting findings emerge from investigating the relationship between the PIMI and public and private investment (figure 2.55). First, countries with stronger PIMs (higher values of the PIMI index) tend to have lower ratios of public investment to GDP (panel a) and higher ratios of private investment to GDP. Second, the lower public investment in countries with high PIMI values can be attributed to the improved efficiency of these investments. In this context, lower public investment may imply an improvement in public procurement and lower red tape and corruption, among others. For the PIMI level, several countries in the region have a ratio of public investment to GDP that is above the international norm (the Republic of Congo, Ethiopia, and Mozambique, among others). Third, having sound PIMs appears to attract private investment-as suggested by the positive association. Having transparent procurement rules and best practices in project appraisal, selection, implementation, and evaluation may help de-risk the country (as well as its investment procedures). Finally, for the PIMI level, some countries in the region have a ratio of private investment to GDP that is above the international norm (Botswana, Namibia, and Zambia). The large countries in the region (South Africa and Nigeria) have ratios that are close to the international norm.
| FIGURE 2.55: PIMI and Investment | |
|
|
|
| NOTE: PIMI Corresponds to average of 2007-10 and public investment (I/Y) to 2014. | NOTE: PIMI corresponds to average of 2007-10 and private investment (I/Y) to 2014. |
| Source: World Bank (2016b). | |
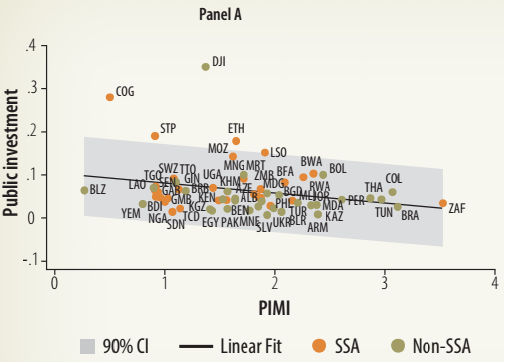
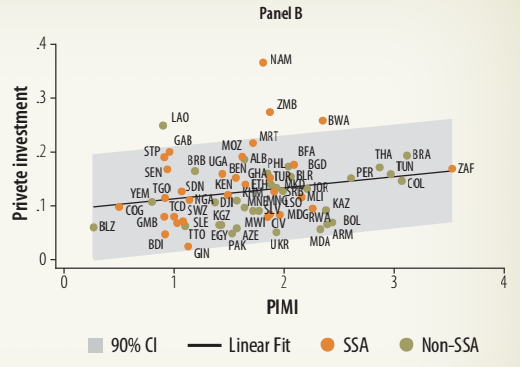
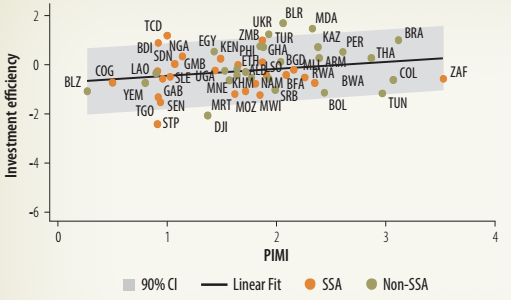
Figure 2.56 displays the relationship between the PIMI and what we call the efficiency of public investment.44 There is a positive and significant relationship between public investment management and the efficiency of public investment. Interestingly, figures 2.55 and 2.56 show that countries with better PIMs tend to have lower but more efficient levels of public investment, and they tend to crowd in private investment. However, relative to the international norm, some countries are clearly underperforming-which is the case of São Tomé and Príncipe, Senegal, Mozambique, and Malawi, among others.
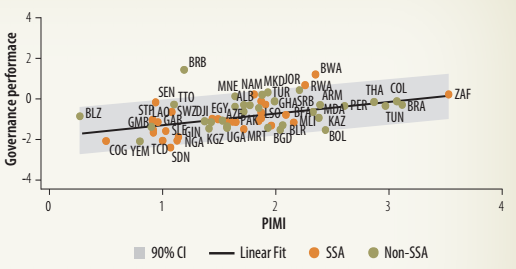
| FIGURE 2.56: PIMI and Efficiency of Public Investment | FIGURE 2.57: PIMI and Governance |
|
|
|
| NOTE: PIMI corresponds to average of 2007-2010 and efficiency to average of 2010-13
| NOTE: PIMI corresponds to average of 2007-10 and governance performance to regulatory quality, rule of law, and control of corruption, Governance indicator from the Worldwide Governance Indicators for 2014. Estimates range from approximately -2.5 (weak) to 2.5 (strong) governance performance. |
| Source: World Bank (2016b). | |
_____________________________________________________________________________________________
44 This is a very broad measure computed as the ratio of growth per capita to the investment-GDP ratio -as suggested by King and Levine (1993).