4 PPPs in Infrastructure: Trends in developing countries
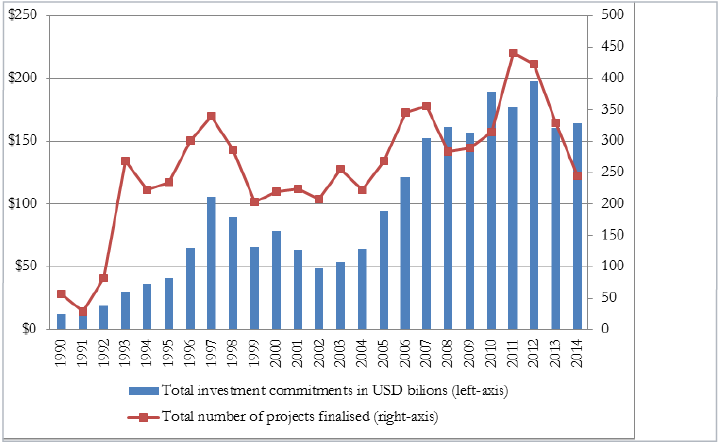
As can be seen from Figure 2, there has been a sharp rise in the private sector's participation in infrastructure during the 1990s, peaking in 1998. After declines for 2 years, both the number and amount rose again for more than a decade until 2012. The average size of projects increased from $182 million in 2003 to $322 million in 2013, but peaked in 2010 at $410 million (World Bank, 2014a). As observed by Flyvbjerg (2014), this is a sign of the growing trend in megaprojects in infrastructure.
However, it is important to note that private finance provides a small portion of aggregate infrastructure investment in the developing world. According to the IMF (World Economic Outlook, October 2014, p. 79, fn 9), "public infrastructure investment still dwarfs private, as infrastructure investment via public private partnerships is still less than a tenth of public investment in advanced economies and less than a quarter of public investment in emerging market and developing economies". The World Bank has also indicated a similar pattern for the last decade in developing countries: "private capital has contributed between 15 and 20 per cent of total investment in infrastructure" (World Bank 2014b, p. 2).
Figure 2
Private participation in infrastructure projects and investment commitments, 1990 – 2014
|
|
Source: World Bank, Private Participation in Infrastructure Projects Database (http://ppi.worldbank.org/
Box 1
Blended Finance- PPPs with Donors
Much like PPPs the concept of blended finance is not clearly defined. For example, a United Nations expert group suggests a broad definition with blended finance encompassing "a large portfolio of potential instruments, including instruments provided by DFIs [development finance institutions] to leverage private finance (…) as well as traditional public private partnerships" and "structured public-private funds and innovative 'implementing partnerships' between a wide range of stakeholders" (United Nations, 2014, p. 37). OECD and the World Economic Forum (OECD-WEF 2015, p. 8) refer to blended finance in a more narrow sense as "the strategic use of development finance and philanthropic funds to mobilize private capital flows to emerging and frontier markets." Donors are increasingly following the latter concept and moving towards channelling aid money through the private sector in the hope that it can leverage large sums of private sector financing. However, Callan and Davies (2013) point out a triple deficit in this donor strategy. First, the term "partnership" is used to cover a bewildering array of arrangements, such that it is almost a semantic cipher. Second, there is little information available on just how specific partnerships are built and implemented. Third, there is as little, or less, information on which partnerships have achieved substantial development impacts, and how. The resultant void tends to attract critics, who see a hidden agenda to help multinational corporations gain a stranglehold over global supply chains, or at least to substitute private finance for official aid, which has declined since 2010 as a percentage of donor GNI. Callan and Davies find "no comprehensive policy framework for business engagement; nor is there any explicit set of principles to guide decisions on the allocation of aid funds to business partnerships" (p.2). Callan and Davis also note that donors tend somewhat to favour corporations headquartered in, or identified with, their own countries. Thus, this new strategy "can give rise to a perception that public-private partnerships are vehicles for the pursuit of donor countries' own international trade and investment promotion agendas" (p. 3). Critics also caution that failed experiences at home are not taken into account in the donor push for PPPs in developing countries. For example, the OECD (Miyamoto and Biousse 2014, p. 31) states "donor countries that have domestic experience in private participation in infrastructure should take them into account-success and failures-when promoting private participation in developing country infrastructure. This applies to countries including Spain and Portugal where the extensive use of PPPs led to overinvestment in domestic infrastructure, contributing to the countries' financial crises. (...) If certain modalities are hugely unsuccessful in OECD countries, they are unlikely to succeed in less developed countries where cost recovery is more difficult".
Moreover, the claim that modest donor involvement through blended finance can leverage large quantities of private investment amounts in developing countries seems questionable. How could incremental reductions in required returns (e.g., through small subsidies or guarantees) make a large number of projects commercially viable, when the private sector consistently points out that the real constraint on investment is the lack of bankable projects? Consequently, the potential for blended finance or leveraging private sector resources through ODA may be overstated. If this is the case, then capacity building for project development deserves greater attention from donors than blended finance.
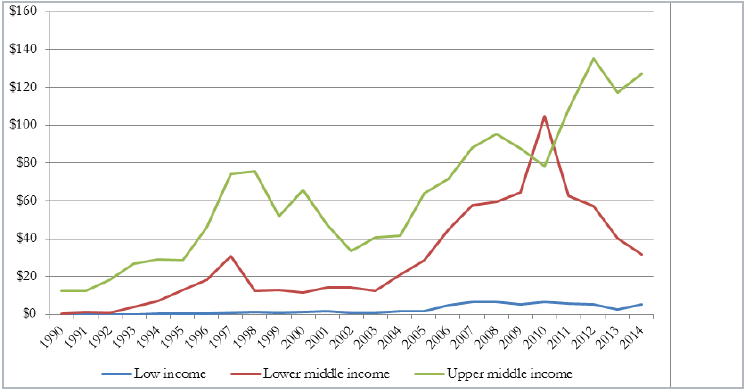
Figure 3a shows that such private sector participation in infrastructure is primarily in upper middle-income countries. The low-income countries did not attract much private sector investment, and there has been a sharp decline in the lower middle-income countries since 2010. Cumulative private investment over the period 1990-2014 in low-income countries was only $61 billion compared to about $1.6 trillion in upper middle-income countries (fig. 3b). In general, PPPs tend to be more common in large and developed markets to allow for a faster recovery of costs and more secure revenues. This implies a selective bias in PPPs, known as 'cream-skimming', which also occurs within countries, with investment directed towards affluent urban areas. Econometric study of the IMF (see Mona, Ruhashyankiko and Yehoue, 2006) also confimred this selection bias. It found that after adjusting for population, PPP concentration was more likely in larger markets with greater consumer demand and macroeconomic stability.
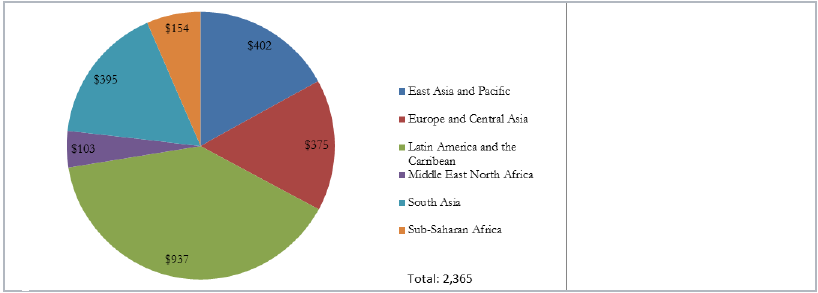
As a region, Latin America received the largest share of private infrastructure investment - $937 billion out of total of around $2.4 trillion - followed by East Asia and Pacific ($402 billion) and South Asia ($395 billion). In fact, Latin America drove the PPP growth in the early-1990s. However, PPP activities in the region remained flat since the mid-1990s due to several factors, including the Argentinian currency crisis and a series of project failures. 6 PPP activities surged in South and East Asia and the Pacific since the early 2000s.
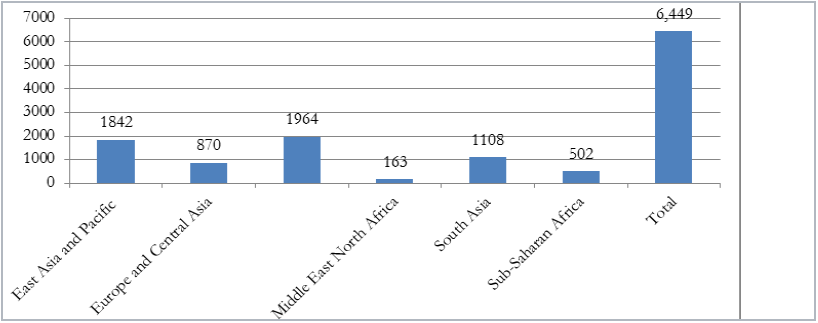
Consistent with the selection bais as revealed in the PPPs' distribution in developing countries by income groups, Sub-Saharan Africa - which lags infrastructure development the most and where 23 of the 36 low-income countries are located - attracted only $154 billion of infrastucture investment from the private sector (fig 4a). Figure 4b presents the total number of infrastructure projects participated in by the private sector. Out of a total of 6,449 infrastructure projects with the private sector involements during the 1990-2014 period, 1,964 were implemented in Latin America and the Carribean, 1,842 in East Asia and the Pacific region and 1,842 in South Asia. In contrast, there were only 502 infrastructure projects finalized in Sub-Saharan Africa with private sector participation.7
Figure 3a
Private participation in infrastructure projects in different categories of developing countries
|
|
Source: As in Figure 2
Figure 3b
Total investment commitments in USD billions by income group (1990-2014)
|
|

Source: As in Figure 2
Figure 4a
Total investment commitments in USD bilions by region (1990-2014)
|
|
Source: As in Figure 2
Figure 4b
Total number of projects finalized by region (1990-2014)
|
|
Source: As in Figure 2
Figure 5a
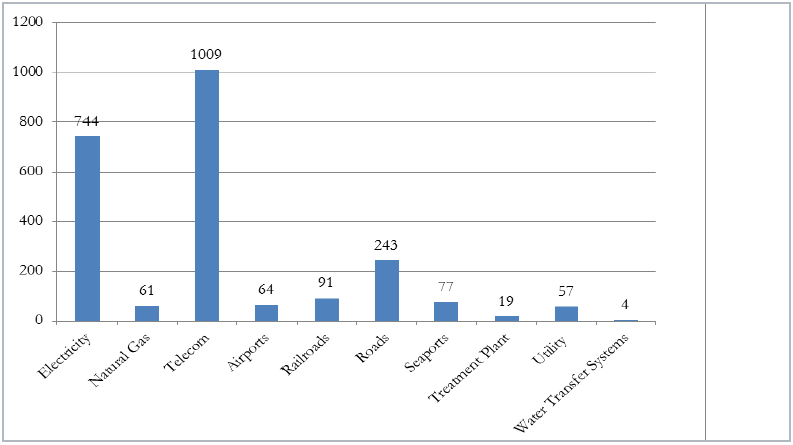
Total investment commitments in USD billions by subsector (1990-2014)
|
|
Source: As in Figure 2
Figure 5b
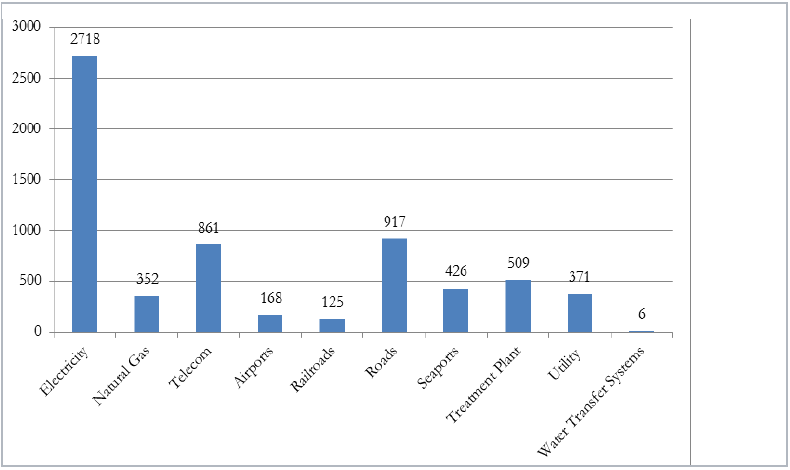
Total number of projects finalized by subsector (1990-2014)
|
|
Source: As in Figure 2
Figure 5a shows that the telecommunications sub- sector received the highest amount of investment (about $1 trillion) from the private sector during the 1990-2014 period, followed by electricity ($744 billion) and roads sub-sector ($243 billion). However, the highest number of projects with private sector participation occurred in electricity generation (2718 projects) compared to only 861 telecommunications projects and 917 roads projects.
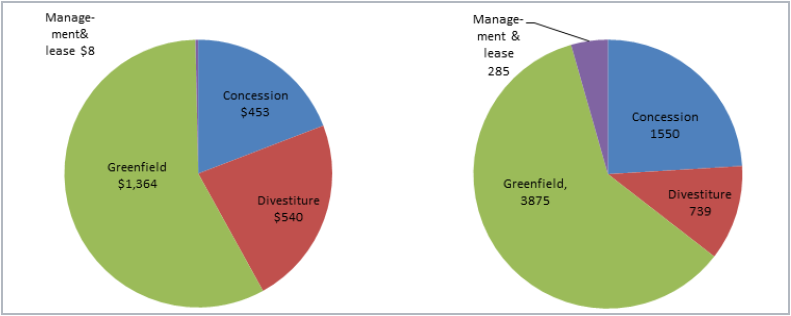
Figures 6a and 6b present total infrastructure investment with private sector involvement by type. It can be seen from figure 6a that "build operate and transfer" is the most preferred mode of infrastructure investment in partnership with the private sector. Figure 6b reveals greenfield investment's dominance, while management and lease has been the least attractive.
Figure 6a
Total investment commitments in USD billions (left-axis, blue bars) and number of projects by PPI Type (right-axis, red scatters) 1990-2014
|
|
| Source: As in Figure 2 |
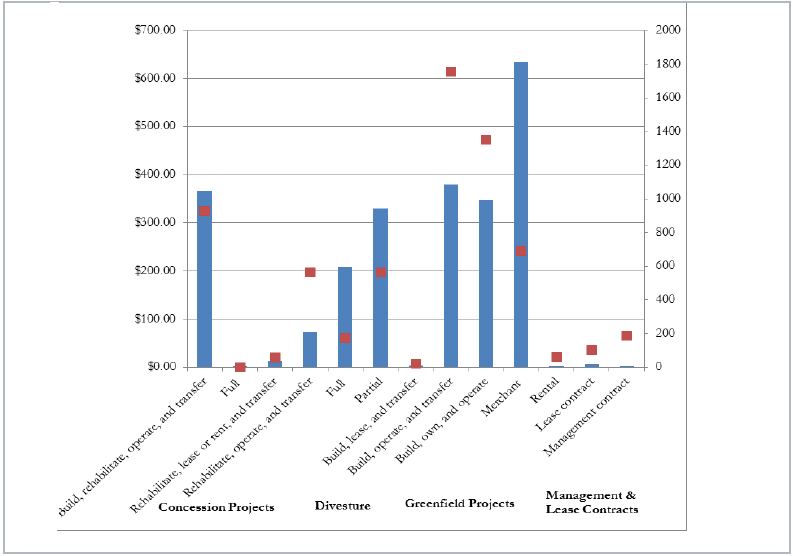
Figure 6b
Share of total investment commitments in USD billions (left graph) and number of projects (right graph) by PPI type
|
|
Source: As in Figure 2
___________________________________________________________________________________________
6 See Trebilcock and Rosenstock (2015) for discussion of these factors.
7 As pointed out by Trebilcock and Rosenstock (2015, p 341), "This pattern suggests that countries that may need basic infrastructure the most are less likely to engage in PPPs."