Empirical Results
To complement the empirical distribution function, Kaplan-Meier curves are used to estimate the probability of a PPP project surviving in developing Asia and other developing regions (Figure 3.5). In developing Asia, this is estimated at above 90% during project contract periods; other developing regions have a lower estimated rate, at 77%.
Figure 3.5: Kaplan-Meier Curve Estimates for PPP Projects in Developing Asia and Other Developing Regions
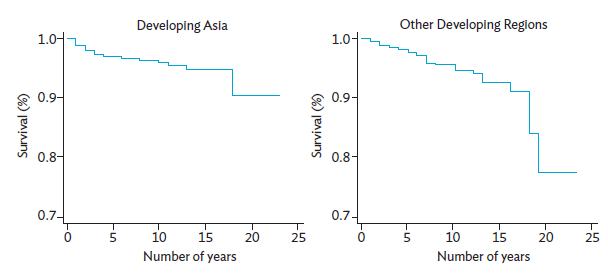
PPP = public-private partnership.
Note: Other developing regions include Latin America, the Caribbean, Sub-Saharan Africa, North Africa, and developing European countries.
Source: Authors.
The Kaplan-Meier curves consistently support the hazard analysis regression results. The survival rate will likely be higher when a local government is the implementing agency for an infrastructure PPP project rather than the national government (Figure 3.6). Solicited projects have a lower hazard rate than unsolicited projects; however, unsolicited projects that underwent competitive bidding have higher survival rates. The presence of a foreign sponsor or the participation of MDBs have a positive impact on a project's survival rate. Government guarantees help PPP projects to be more viable. And greenfield projects have higher survival rates than other types of private participation.
Using the hazard regression analysis, Table 3.1 shows the baseline survival model of PPP projects with project variables and macroeconomic indicators for developing Asia. Based on the empirical results, more than 80% of PPPs financed by the private sector decrease the hazard rate of a project, although this is not significant. Local government PPP contracts significantly reduce failure rates. Local governments contribute to infrastructure development because they can best determine the kind of infrastructure projects that will benefit their constituents and the local economy.
Figure 3.6. Kaplan-Meier Curve Estimates for Developing Asia PPPs by Project-Based Factors
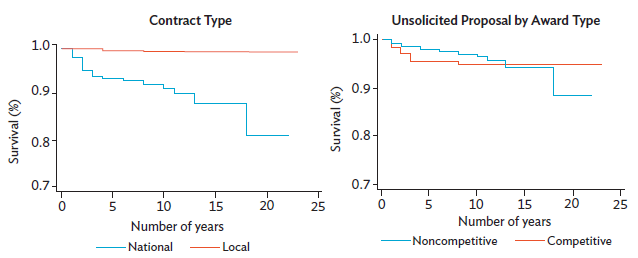
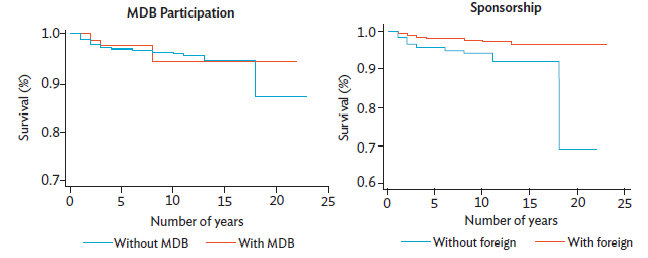
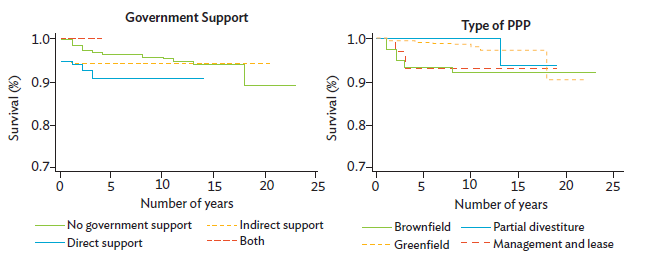
MDB = multilateral development bank, PPP = public-private partnership.
Source: Authors.
Table 3.1: Parametric Hazard Regression for Developing Asia
Variable | Coefficients | Hazard Ratio |
Private participation (private share >80%) | -0.368 | 0.692 |
Local government contract | -4.224*** | 0.015*** |
Solicited proposal | -2.760*** | 0.063*** |
Unsolicited proposal through competitive bidding | -1.888*** | 0.151*** |
Multilateral development bank participation | -1.888** | 0.151** |
Foreign sponsor | -0.799* | 0.45* |
Base = No government support Direct government support Indirect government support | -0.314 | 0.731 |
-3.086*** | 0.046*** | |
GDP per capita compounded growth rate | -0.414** | 0.661** |
Terms of trade interaction with G3 growth rate | 0.002 | 1.002 |
% trade to GDP interaction with G3 growth rate | 0.002 | 1.002 |
Ratio of debt to GDP | -0.095*** | 0.91*** |
Natural disaster occurrence | 4.894*** | 133.5*** |
Law and order | -4.124** | 0.016** |
Corruption | -7.235*** | 0.001*** |
/1n_p | 1.337 |
|
p | 3.807 |
|
1/p | 0.263 |
|
GDP = gross domestic product, MDB = multilateral development bank, PPP = public-private partnership.
Notes:
1. Other PPP include management and lease contracts and partial divestiture.
2. G3 includes the United States, euro area, and Japan.
*** p < 0.01 ** p < 0.05 * p < 0.10
Source: Authors.
PPP projects are typically initiated through solicited or unsolicited proposals, and each follows a different process, which often leads to different levels of involvement between parties (AECOM Consult 2007). Solicited PPP projects, initiated by the public sector, have contributed significantly to the success of these projects because they are usually in sync with government development plans. Unsolicited proposals tend to gain less government support because they often do not meet the priority investment requirements of national infrastructure plans (Yun et al. 2015). For governments handling unsolicited proposals, one option to deal with this problem is through competitive bidding in which no bidder has a predefined advantage (World Bank 2002). In line with this, the interaction term between unsolicited projects and competitive schemes has a negative and significant effect on the hazard rate.
The results show that the involvement of MDBs can significantly increase the success of projects in developing Asia. MDBs can play an important role in reducing funding gaps for infrastructure and, as earlier noted, for facilitating regional cooperation for the provision of public goods in neighboring countries. Further, PPP projects with foreign sponsors can reduce project failures, a result consistent with the findings of Reside (2009).
The results also suggest direct government subsidies and indirect support through guarantees can help PPP projects become more viable. Governments can bear some project risks by providing capital and revenue subsidies or in-kind contributions, such as land, favorable government policies to investment, and incentives (loan guarantees for subsovereign and nonsovereign borrowing, for example). The results confirm that the presence of at least one PPP unit can reduce a project's hazard rate.
The model also includes different types of PPPs; for example, whether infrastructure was built or upgraded. Compared with projects that improve and expand existing infrastructure (brownfield), new infrastructure projects (greenfield) have negative and significant elasticity with the hazard rate. This differs from the findings of the World Bank (2016) that show greenfield projects are the most susceptible to renegotiation, largely because of their complexity and the risks they can carry, and that greenfield projects are more prone to improper selection criteria and procurement procedures. The results of our study can be explained by greenfield projects having greater design flexibility to meet project requirements and requiring less maintenance.
Theoretical approaches and the literature emphasize the relevance of fiscal, macroeconomic, and political factors in deciding whether to contract out. Intuitively, these factors can affect a project's operation and outcomes. The results confirm several claims in the literature that robust economic growth leads to good project outcomes because demand for output rises. The average real GDP per capita growth during 1990-2015 had a negative and significant coefficient for the hazard rate; hence, economic development is also significant for project success. For country competitiveness, the positive impact from terms-of-trade growth and trade as percentage of GDP have no significant impact on the viability of PPP projects. Consistent with other findings, the occurrence of natural disasters in a country during contract periods increase the risk of projects failing.
Fiscal factors that influence PPP outcomes are investigated by Checherita (2009) and Hammami, Ruhashyankiko, and Yehoue (2006), among others. Similar to these studies, our results show that a higher ratio of debt to GDP has negative elasticity with a project's hazard rate, and can significantly contribute to project success. For institutional and political factors, indicators for law and order, and level of corruption, support the notion that more transparency and less corruption can significantly reduce a project's hazard rate.
Table 3.2 shows the hazard ratio between developing Asia and other developing regions.3 A significant difference between the two regions is that, as the private sector's share in PPP investments appears to get larger (above 80%), the hazard rate significantly increases, suggesting that a proper mix with public investments will help reduce risks. The participation of MDBs in the preparation of PPP projects may not significantly influence project success.
Table 3.2: Parametric Hazard Regression between Developing Asia and Other Developing Regions
Item | Developing Asia | Other Developing | ||
Variables | Coefficients | Hazard ratio | Coefficients | Hazard ratio |
Private participation (private share >80%) | -0.368 | 0.692 (0.533) | 1.136* | 3.113* |
Local government contract | -4.224*** | 0.015*** | 0.024 | 1.024 |
Solicited proposal | -2.760*** | 0.063*** | -3.042** | 0.048** |
Unsolicited proposal through competitive bidding | -1.888*** | 0.151*** | -0.581 | 0.56 |
Multilateral development bank participation | -1.888** | 0.151** | 0.376 | 1.456 |
Foreign sponsor | -0.799* | 0.450* | 0.597 | 1.816 |
Base = No government support Direct government support Indirect government support | -0.314 | 0.731 | -1.060 | 0.346 |
-3.086*** | 0.046*** | |||
GDP per capita compounded growth rate | -0.414** | 0.661** | 0.097 | 1.102 |
Terms of trade interaction with G3 growth rate | 0.002 | 1.002 | 0.011*** | 1.011*** |
% trade to GDP interaction with G3 growth rate | 0.002 | 1.002 | -0.004* | 0.996* |
Ratio of debt to GDP | -0.095*** | 0.91*** | -0.032*** | 0.968*** |
Natural disaster occurrence | 4.894*** | 133.5*** | 2.139*** | 8.489*** |
Law and order | -4.124** | 0.016** | 1.773** | 5.887** |
Corruption | -7.235*** | 0.001*** | -7.916*** | 0.000*** |
1.161** -2.161** | ||||
/1n_p | 1.337 |
| 1.05 |
|
P | 3.807 |
| 2.858 |
|
1/p | 0.263 |
| 0.350 |
|
Observations | 1,201 |
| 854 |
|
GDP = gross domestic product, PPP = public-private partnership.
Notes:
1. Standard errors in parentheses.
2. G3 includes the United States, euro area, and Japan.
3. Other developing regions include Latin America, the Caribbean, Sub-Saharan Africa, North Africa, the Middle East, and developing European countries.
*** p<0.01 ** p<0.05 * p<0.10
Source: Authors.