Data
The main data source for PPP projects in developing countries is the World Bank's Private Participation in Infrastructure Database, which records PPP projects from publicly available sources. From the dataset, we specify regression models for 12 low-and middle-income countries which have data available for financial and capital markets during 1995-2015. In line with Hammami et al. (2006) and Ba, Gasmi, and Um (2010), variables drawn from the literature that may explain investments in PPPs in the sample countries have been collected, and they are listed in Appendix A6.1. They include, among others, aggregate demand, size of the economy and its growth rate, finance sector variables, and fiscal condition, as well as institutional factors, such as government stability. Unlike previous studies, several volatility measures, including growth, inflation, and exchange rate volatility, are added to the estimation model. This is because macroeconomic stability is expected to increase private investment in infrastructure, as many empirical studies emphasize. To check for multicollinearity, pairwise correlations of these variables are calculated in Appendix A6.2.
The other sources of data are the Word Bank's World Development Indicators Database, the International Monetary Fund's International Financial Statistics, the Bank for International Settlements, and the PRS Group Inc.'s International Country Risk Guide, which is used extensively in econometric studies of investment for measures of institutional quality, and economic, financial, and political risks.
Figure 6.1 shows PPP investment and the number of projects have increased in the sample of 12 developing countries since the mid-1990s, especially since 2003. The peak was in 2012, and both investment and number of projects decreased substantially since then because stringent capital requirements made banks more reluctant to extend long-term and risky loans to infrastructure projects after the 2008 global financial crisis. Figure 6.2 shows that average annual PPP investment by economy has tended higher in the 12 countries, especially in Brazil and India.
Figure 6.1: PPP Infrastructure Investment in 12 Emerging Economies, 1995-2015
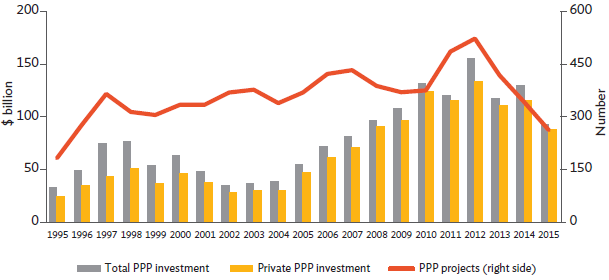
PPP = public-private partnership.
Notes:
1. Total private participation in infrastructure investment includes private and public investment, and is the sum of investment in physical assets and payments to governments. It also includes private investment alone in infrastructure projects.
2. The 12 countries were chosen because they had sufficient data for financial and capital markets in the World Bank's Private Participation in Infrastructure Database.
3. The countries are Argentina, Brazil, Chile, Colombia, India, Indonesia, Malaysia, Mexico, the People's Republic of China, South Africa, Thailand, and Turkey.
Source: World Bank Private Participation in Infrastructure Database (accessed 15 June 2017).
Figure 6.2. Average Annual PPP Infrastructure Investment by 12 Emerging Economies, 1995-2015 ($ million)
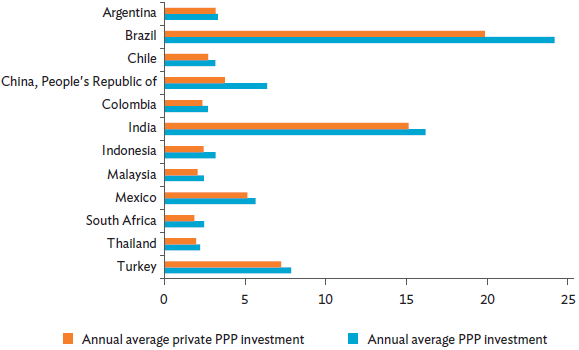
PPP = public-private partnership.
Notes:
1. Total private participation in infrastructure investment includes private and public investment, and is the sum of investment in physical assets and payments to governments. It also includes private investment alone in infrastructure projects.
2. The 12 countries were chosen because they had sufficient data for financial and capital markets in the World Bank's Private Participation in Infrastructure Database.
3. The countries are Argentina, Brazil, Chile, Colombia, India, Indonesia, Malaysia, Mexico, the People's Republic of China, South Africa, Thailand, and Turkey.
Source: World Bank Private Participation in Infrastructure Database (accessed 15 June 2017).
Table 6.2 shows the descriptive statistics of all variables used in the estimation for the 12 countries. The descriptive statistics confirm that these countries have relatively developed stock markets and banking sectors, compared with their government and corporate bond markets.
Table 6.2: Descriptive Statistics
| Variable | Number | Mean | Minimum | Maximum | Standard Deviation |
| Bond-GDP ratio | 212 | 0.40 | 0.01 | 1.21 | 0.28 |
| 212 | 0.01 | 0.00 | 0.08 | 0.01 | |
| 212 | 0.01 | 0.00 | 0.06 | 0.01 | |
| Credit-GDP ratio | 212 | 0.56 | 0.09 | 1.61 | 0.39 |
| Government bonds-GDP ratio | 212 | 0.24 | 0.00 | 0.89 | 0.18 |
| Corporate bonds-GDP ratio | 212 | 0.16 | 0.00 | 0.73 | 0.17 |
| Stock market capitalization-GDP ratio | 212 | 0.74 | 0.06 | 3.04 | 0.62 |
| Log of GDP per capita | 212 | 8.52 | 6.32 | 9.67 | 0.72 |
| GDP growth | 212 | 0.04 | -0.11 | 0.14 | 0.04 |
| Inflation rate | 212 | 0.08 | -0.01 | 0.88 | 0.13 |
| GDP growth volatility | 212 | 0.03 | 0.01 | 0.08 | 0.02 |
| Inflation volatility | 212 | 0.34 | 0.01 | 6.52 | 1.31 |
| Real effective exchange rate volatility | 212 | 0.02 | 0.00 | 0.15 | 0.02 |
| Exchange rate regime | 212 | 0.13 | 0.00 | 1.00 | 0.34 |
| Log of government stability index | 212 | 2.08 | 1.58 | 2.40 | 0.19 |
GDP = gross domestic product, PIP = private investment in PPP, PPP = public-private partnership.
Source: Authors' estimates.