Infrastructure Development in Southeast Asia
PPPs are playing an increasing role in helping to meet Southeast Asia's huge demand for infrastructure, though their level of use varies across countries. PPPs do not play a prominent role in countries where public funds are abundant and public institutions are strong, such as Brunei Darussalam and Singapore. But they are being actively promoted in Indonesia, Malaysia, the Philippines, Thailand, and Viet Nam, where public funds for infrastructure are tight. In these countries, the public sector's commitment to PPPs and often ambitious PPP project plans are not always in sync; this is particularly the case in Indonesia.
Singapore has the region's most developed infrastructure, which is on a par with or even better than many advanced economies. As a compact city-state focusing on services, Singapore carefully calibrates its infrastructure to support specific economic demands and constraints. The World Economic Forum's Global Competitiveness Report 2017-2018 ranked Singapore second in its global competitiveness index and infrastructure ranking, the position it has held since 2012. The country's institutional environment is closely related to the efficient implementation of infrastructure. The World Economic Forum defines this as influential factors of "investment decisions and the organization of production," with the institutional environment playing a "key role in the ways in which societies distribute the benefits and bear the costs of development strategies and policies" (WEF 2017). Because PPPs require a supportive business environment that underpins investment decisions, it is important for governments to maintain good and stable macroeconomic conditions. Figure 11.1 shows, as expected, a close correlation between the World Economic Forum's infrastructure and institutional scores.
Figure 11.1 shows a consistent pattern of close links between macroeconomic and institutional variables and infrastructure development in advanced economies, but this pattern is weak in developing ones. Intuitively, it can be said that infrastructure is needed to foster economic growth and macroeconomic stability, while a healthy business climate, represented by positive macroeconomic conditions and supportive institutional frameworks, will attract more investment, including for infrastructure. Most Southeast Asian countries score highly in the World Economic Forum's survey, though Indonesia, the Philippines, and Thailand show wide score gaps on infrastructure and institutions. These countries, therefore, have more room to use their favorable macroeconomic performance to attract infrastructure investment.
Figure 11.1: Infrastructure and Institutions Scores in Asia and the Pacific, 2017-2018
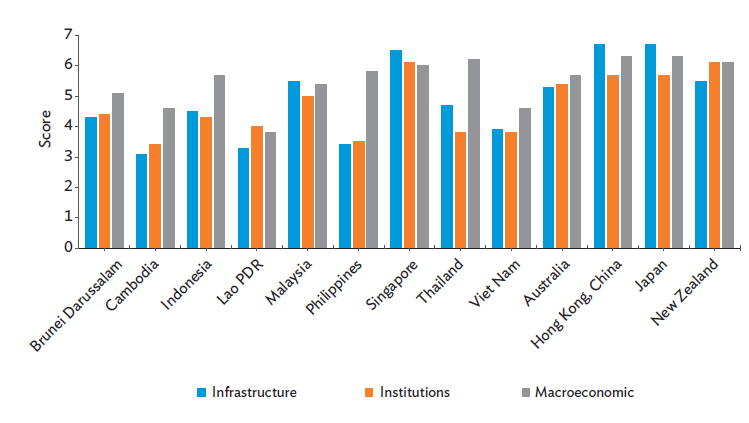
Lao PDR = Lao People's Democratic Republic.
Note: The scores range from 1 to 7, with 7 being the highest.
Source: World Economic Forum. 2017. The Global Competitiveness Report 2017-2018. Geneva.
Infrastructure development in Cambodia, the Lao People's Democratic Republic (Lao PDR), Myanmar, and the Philippines lags far behind the average for East Asia and Pacific in the World Economic Forum survey. Because PPPs are still at an early stage of policy maturity in these countries, most financing for infrastructure come from public funds, including loans and, to a lesser extent, privatization.
Indonesia and Myanmar have both invested heavily in fixed assets (capital formation), though not all these assets are in infrastructure. Even so, data for fixed assets can be used as a proxy for infrastructure investment for these countries. Under the National Medium-Term Development Plan, the country needs to spend Rp5,519 trillion ($409 billion) from 2015 to 2019 to meet its major infrastructure needs; this works out at Rp1,107 trillion ($82 billion) a year, or 9%-10% of the country's nominal gross domestic product (GDP). The infrastructure needs include 15 airports, 24 seaports, 2,650 kilometers of road, 3,258 kilometers of rail, and bus rapid transit for 29 cities. Indonesia's state-owned enterprises (SOEs) and the private sector are expected to fund close to 60% of this infrastructure in the plan period.
In the Philippines, the Public-Private Partnership Center energetically promotes PPPs. Since 2010, 16 PPP contracts have been awarded, worth  332 billion ($6.4 billion). Completed projects include the Mactan-Cebu International Airport Terminal 2, the Ninoy Aquino International Airport expressway in Manila, and the construction of 12,202 classrooms nationwide. Under construction at the time of writing is the Bulacan Bulk Water Supply Project.
In Thailand, 44 PPP projects were underway in transport, logistics, utilities, telecommunication, and property at the end of 2015, according to the State Enterprise Policy Office. The office's Public-Private Partnership Master Plan, 2015-2019 determines the sectors and types of commercial and social investments for PPPs. These fall into two types: those requiring private sector investment and those encouraging private sector investment.
Malaysia has used PPPs for several big infrastructure projects, mostly in power and transport. From 1983 to 2016, there were 824 PPP projects and privatizations (privatizations are included in the country's definition of a PPP). These projects cut some 113,000 government jobs and saved the government RM207 billion ($53 billion) in capital expenditure. A drawback of the country's PPP unit is that it does not have guidelines to manage unsolicited project proposals.
Viet Nam is a newcomer to infrastructure PPPs, although build-operate-transfer projects have been recognized since 1992 in an amendment to the Foreign Investment Law. Since 1990, 83 projects reached financial close. Most PPP projects in Viet Nam are in power and transport.
In all five countries, PPP spending is typically less than 1% of GDP, while public spending in infrastructure varies from 2% to 10% of a country's GDP (Table 11.1).
Budget spending on infrastructure is largest in Malaysia, Viet Nam, and Thailand. Spending in Indonesia has increased markedly since 2015, though the amount as a proportion of GDP is still low. Caution is needed in comparing the country data in Table 11.1 because the five countries have different definitions of PPPs that are influenced by their systems of government. For instance, government spending may or may not include national and subnational spending, and, as already noted, Malaysia includes privatizations in its definition of a PPP.
Table 11.1: PPP and Public Spending on Infrastructure in Southeast Asia, 2005-2015 (% of GDP)
| Year | Indonesia | Malaysia | Philippines | Thailand | Viet Nam | |||||
| 2005 | 0.08 | 3.05 | 1.48 | 9.40 | 0.32 | 1.82 | 0.43 | 6.24 | 0.56 | 5.59 |
| 2006 | 0.11 | 3.91 | 1.11 | 9.56 | 0.17 | 1.69 | 0.31 | 6.15 | 0.48 | 5.30 |
| 2007 | 0.15 | 3.42 | 0.98 | 9.54 | 0.14 | 2.07 | 0.27 | 6.3 | 0.19 | 6.03 |
| 2008 | 0.22 | 2.99 | 0.59 | 9.64 | 0.12 | 2.42 | 0.28 | 5.82 | 0.17 | 5.99 |
| 2009 | 0.18 | 2.80 | 0.37 | 10.08 | 0.47 | 2.88 | 0.30 | 6.11 | 0.22 | 8.51 |
| 2010 | 0.19 | 2.50 | 0.14 | 9.81 | 0.61 | 2.87 | 0.18 | 5.55 | 0.33 | 8.09 |
| 2011 | 0.15 | 2.85 | 0.07 | 9.53 | 0.61 | 1.84 | 0.22 | 5.00 | 0.61 | 6.76 |
| 2012 | 0.20 | 3.16 | 0.19 | 10.50 | 0.64 | 2.84 | 0.29 | 5.08 | 0.56 | 7.60 |
| 2013 | 0.19 | 3.54 | 0.26 | 10.21 | 0.65 | 2.58 | 0.26 | 5.05 | 0.49 | 7.72 |
| 2014 | 0.22 | 2.96 | 0.24 | 9.16 | 0.40 | 2.63 | 0.42 | 4.58 | 0.58 | 6.56 |
| 2015 | 0.19 | 3.36 | 0.21 | 8.81 | 0.50 | 3.08 | 0.31 | 5.78 | 0.48 | 6.38 |
GDP = gross domestic product, GFCF = gross fixed capital formation, PPP = public-private partnership.
Note: General government GFCF, PPP, and GDP in billions of constant 2011 international dollars.
Source: International Monetary Fund, Investment and Capital Stock Dataset 1960-2015.