Indonesia
Since the Asian financial crisis, Indonesia's infrastructure spending growth has been less than its economic growth, leading to a decreasing stock of infrastructure as a percentage of GDP (Figure 11.3). Having only a small budget for infrastructure means that spending on new projects has been insignificant (and even lower than the allocation for maintaining infrastructure). This situation, combined with an ineffective policy for prioritizing infrastructure projects, has hampered economic growth, and is manifested in congested roads in towns and cities, high logistics costs, and electricity blackouts. Indeed, Indonesia has built almost no new infrastructure outside Java Island since the Asian financial crisis. But that situation has been changing since 2015.
Figure 11.3: Infrastructure Stock in Indonesia, 1995-2015
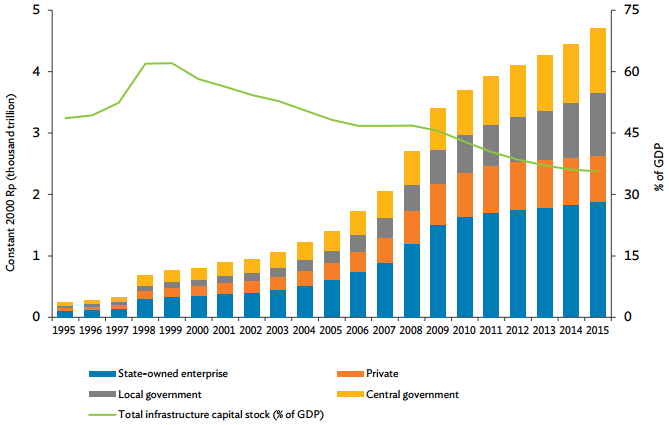
GDP = gross domestic product, Rp = rupiah.
Note: Capital stock estimated using the perpetual inventory method, assuming 5% depreciation rate.
Source: Australia Indonesia Partnership for Economic Governance.
Since taking office in 2014, President Widodo has emphasized the significant role that infrastructure plays in the country's economic development-a departure from his predecessor's stance-and has pledged to develop infrastructure, particularly outside Java Island. He has abolished energy subsidies and allocated significant funding for health, education, and infrastructure. Although accelerating infrastructure is a top agenda of the Widodo administration, PPPs in Indonesia are still often complex and require long lead-in times before getting underway. Table 11.3 shows the National Development Planning Agency's projections for the country's infrastructure plan over 2015-2019, based on three scenarios.
Table 11.3: Indonesia's Priorities and Financing Needs, 2015-2019
(Rp billion)
| Infrastructure Plan | Infrastructure Financing Needs 2015-2019 | Scenario 1: Full Scenario | Scenario 2: Partial Scenario | Scenario 3: Baseline |
| New roads: 2,650 km | Roads | 1,274 | 851 | 637 |
| Highway: 1,000 km | Rail system | 278 | 222 | 140 |
| Road maintenance:46,770 km | Urban transport | 155 | 115 | 75 |
| Bus corridors: 2 | Sea transport | 563 | 424 | 282 |
| New seaports: 24 | Ferry and other water transport | 91 | 80 | 60 |
| Seaport development: 59 | Air transport | 182 | 165 | 100 |
| Pioneer cargo ships:26 | Electricity | 1,080 | 762 | 714 |
| New airports: 15 | Energy and gas | 535 | 420 | 268 |
| Airport infrastructure development | Water resources | 1,091 | 845 | 645 |
| Airplanes: 20 | Water and sanitation | 666 | 450 | 330 |
| Rail lines: 2,159 km | Public housing | 384 | 247 | 180 |
| Intracity rail lines:1,099 km | Information and communication technology | 242 | 200 | 130 |
| Total | 6,541 | 4,781 | 3,561 |
km = kilometer, PPP = public-private partnership, Rp = rupiah, SOE = state-owned enterprise. Note: SOEs and PPPs are expected to fill the funding gap since the central government can only fulfil about 40% of the financing needs of its infrastructure plan.
Sources: Ministry of Finance, Government of Indonesia. 2016. State Budget for the 2016 Fiscal Year. Jakarta; and National Development Planning Agency, Government of Indonesia. 2014. National Development Agenda 2015-2019. Jakarta.
In 2015, the government announced that several infrastructure projects that were initially assigned to SOEs would be done as PPPs, with the public funds freed up from this being allocated to necessary but nonviable projects that would be built by SOEs. As part of this effort, several long-abandoned infrastructure projects-for example, transprovincial roads and rail links on the islands of Kalimantan, Sulawesi, Sumatera, and Papua-have been completed or nearly completed. The national government also provides special transfers to subnational governments to build infrastructure. This funding, however, has increased the national debt, though it is still manageable at below 27% of GDP.