3.1 Prevalence of renegotiation
The prevalence of renegotiation across the entire dataset is shown below in Figures 1 and 2. Figure 1 shows the prevalence of renegotiation in any individual year after financial close (for example 7% of projects had a renegotiation in the third year after financial close). Figure 2 shows the prevalence of renegotiation up to that point in time (for example 20% of projects experienced a renegotiation within the first four years after financial close). It should be noted that the number of projects on which this information is based reduces for later years. This is because, in order to calculate the prevalence of an event in a certain year, we can only assess projects which have been running for at least that length of time.
It should also be noted that all the projects in this study are ongoing, and may have renegotiations in the future. This data will therefore underrepresent the prevalence of these events.
Figure 1: Prevalence of renegotiation in each year after financial close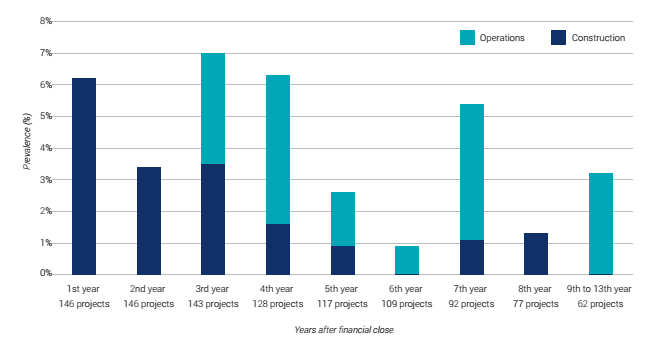
Figure 2: Prevalence of renegotiation, by year N after financial close
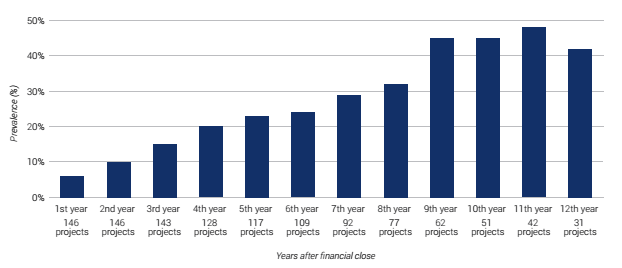
Figure 3: Prevalence of renegotiation by region, based on 146 projects
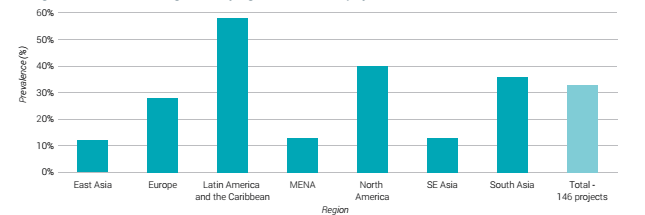
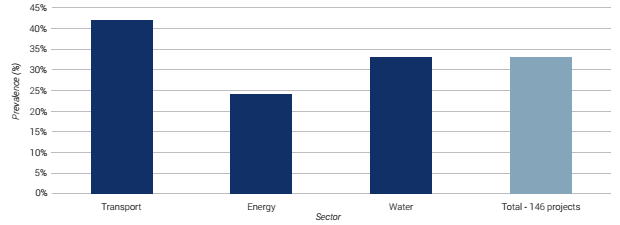
Figure 4: Prevalence of renegotiation by sector, based on 146 projects
In total, our study found 48 examples of renegotiation out of the 146 projects for which this data was available, which is an incidence of 33%. This included 12 in Europe, 25 in Latin America, five in India and single examples in the other regions. The prevalence of renegotiation in Latin America is partly due to the approach taken in that region with 'rebalancing'. This approach blurs the distinction between renegotiation and adjustments, which was not distinctly picked up in the data collection process. Consequently, for the purpose of this data analysis, the study results do not differentiate between renegotiation and rebalancing in Latin America.
It should be noted that the prevalence of renegotiation results is heavily influenced by the timeframe that was selected for this research (i.e. reaching financial close between 2005 and 2015).
While all projects in the sample have been running for at least two years, this reduces for each year after, and only 50 projects have been in progress for over eight years. The influence of this is clear in Figure 2, showing the prevalence of renegotiation, by year N after financial close. While only 33% of projects experienced renegotiation in the entire sample, the data indicates that almost 20% of the ongoing PPPs had experienced renegotiation by their fourth year after financial close, and 45% of PPPs by their tenth year after financial close. This suggests that the true prevalence of renegotiation is likely to be higher due to the timescales involved, noting also that renegotiation prevalence does not appear to increase substantially after year nine. The timescales also means that any potential handback issues are not captured in the data.
Had the same set of projects been used for each year after financial close, Figure 2 would have been cumulative. A different set of projects is used for each year (year N) after financial close as not all of the projects have reached year N at the time of completing this study. The prevalence drops off in later years due to the different set of projects.
A large number of renegotiations took place between two and four years after financial close. Out study suggests that, it takes some time for issues or challenges to arise on a project before a renegotiation is initiated. The existing literature suggests that there can be a tendency in some jurisdictions to sign a PPP contract and renegotiate very soon after. Figure 1 shows that renegotiation is more likely in year one than in year two, although given the small number of occurrences involved it is not possible to draw any strong conclusions.