7 Global and sample data
As part of the process of selecting projects which to investigate for this research, a Master Database of PPPs (Master Database) was created by combing existing databases available online. This was completed using the criteria that the projects were in economic infrastructure and reached financial close between 2005 and 2015. The process followed is described in the Methodology. Presented below is some analysis from the Master Database.
Table 8: Breakdown of master database by region and sector
Region | Energy | Transport | Waste | Water | Totals | % |
Australia and New Zealand | 0 | 32 | 1 | 4 | 37 | 1.0% |
East Asia | 281 | 100 | 73 | 42 | 496 | 13.3% |
Europe | 93 | 423 | 73 | 54 | 643 | 17.2% |
Latin America & Caribbean | 511 | 358 | 32 | 79 | 980 | 26.2% |
Middle East, North Africa | 140 | 68 | 3 | 38 | 249 | 6.7% |
North America | 2 | 117 | 3 | 6 | 128 | 3.4% |
South East Asia | 164 | 56 | 4 | 14 | 238 | 6.4% |
South Asia | 317 | 466 | 0 | 7 | 790 | 21.1% |
Sub-Saharan Africa | 114 | 57 | 0 | 4 | 175 | 4.7% |
Totals (number) | 1622 | 1677 | 189 | 248 | 3736 (100%) | |
Totals (%) | 43.4% | 44.9% | 5.1% | 6.6% | ||
Table 9: Percentage of projects in each region
Region | Percentage of projects | Number of projects |
Australia and New Zealand | 1.0 % | 37 |
East Asia | 13.3 % | 496 |
Europe | 17.2 % | 643 |
Latin America & Caribbean | 26.2 % | 980 |
Middle East, North Africa | 6.7 % | 249 |
North America | 3.4 % | 128 |
South East Asia | 6.4 % | 238 |
South Asia | 21.1% | 790 |
Sub-Saharan Africa | 4.7 % | 175 |
Total |
| 3736 |
Table 10: Composition of master database by sector
Sector | Percentage of projects | Number of projects |
Transport | 44.9 % | 1677 |
Energy | 43.4 % | 1622 |
Water | 6.6 % | 248 |
Waste | 5.1 % | 189 |
Total |
| 3736 |
Table 11: Composition of master database by financial close date
Financial close (by period)* | Percentage of projects | Number of projects |
Period 1 | 20.0% | 747 |
Period 2 | 24.5% | 914 |
Period 3 | 28.7% | 1072 |
Period 4 | 26.8% | 1003 |
Total |
| 3736 |
*Periods were defined as:
• Period 1 - Jan 2005 to Sept 2007
• Period 2 - Oct 2007 to June 2010
• Period 3 - July 2010 to Mar 2013
• Period 4 - Apr 2013 to Dec 2015
Figure 15: Capital value of projects in master database
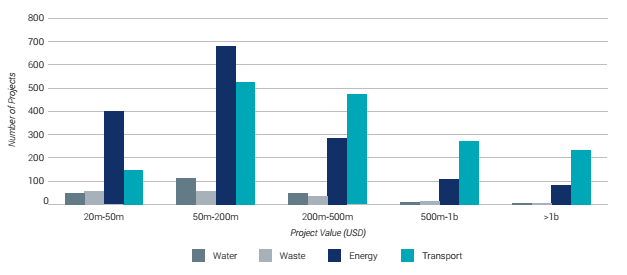
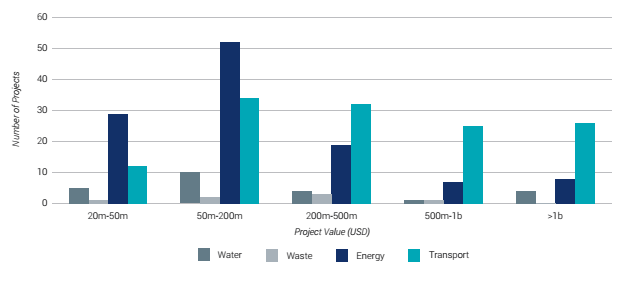
Figure 16: Capital value of projects in sample database