1.1.2. Regional trends
The investments in East Asia and Pacific region grew by 19% in 2011, reaching US$17.2 billion in 2012 (Figure 3). In 2012, most investment in this region went to the energy sector (US$8.9 billion), followed by the telecom sector (US$4.3 billion), the transport sector (US$3.5 billion), and the water and sewage sector (US$355 million). China had the most projects (33 in total) in 2012 and Malaysia attracted the largest amount of investment (US$5.1 billion). Greenfield projects constituted 68% of all projects and 66% of the total investment. The number of projects cancelled or under stress in this region was approximately 10% of the total investment, representing 86 cases from 1990 to 2012.14
Figure 3. Regional Composition of Investment
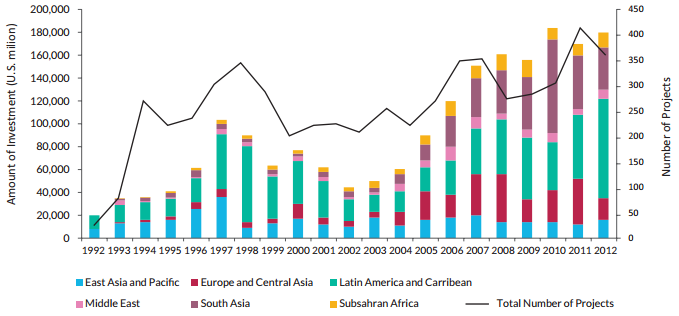
Source: World Bank and PPIAF, PPI Project Database
As a result of the economic crisis, PPP investment in Europe and Central Asia declined by approximately 48% in 2011 to US$22.5 billion.15 Despite this sharp decline, the region still constituted 12% of global PPP investment. In 2012, Ukraine was the most active country with 16 energy projects and commitments of US$520 million. The most common partnership in this region was the greenfield project, comprising approximately 56% of the total investment and 45% of the total project. The telecom sector captured approximately 54% of the total investment made between 1990 and 2012; the number of projects cancelled or under stress in this region was approximately 2% of the total investment, representing 36 cases.
The LAC region saw a sharp increase in PPP investments, from US$56.9 billion in 2011 to US$87.0 billion in 2012, although the number of PPP projects declined from 95 in 2011 to 78 in 2012. In total, this region constituted 48% of global investment, the largest global share for a particular region in the past two decades. Between 1990 and 2012, the telecom sector attracted approximately 42% of the total investment. As in the previous two regions, greenfield projects were the most common type, receiving 41% of total investments and 52% of total projects. The number of projects cancelled or under stress in this region was approximately 7% of the total investment, representing 135 cases.16
In the Middle East and North African region, PPP investments rapidly increased from US$3.9 billion to US$6.7 billion, with a corresponding doubling of the number of project closures. However, investments in this region in 2012 comprised only 4% of the global investments, approximately 0.4% of regional GDP.17 The telecom sector dominated the investment in the region, increasing by 64% from 1990 to 2012. The most common type of partnership is the greenfield, as in other parts of the world. The number of projects cancelled or under stress in this region was approximately 1% of the total investment, amounting to seven cases.18
South Asia experienced a 20% decline in PPP project investments in 2012, from US$43.1 billion in 2011 to US$35.1 billion. The number of the projects reaching financial closure remained stable, with 123 projects in 2011 to 128 in 2012. Despite the significant decline in total investments, South Asia was one of the most active regions in the world. India attracted the most regional investments (US$31.2 billion) with 106 projects in 2012. In total, private investment comprised 1.5% of the regional investment. A majority of PPP projects in Bangladesh and Pakistan were backed by payment guarantees from the central government and credit support from Asian Development Bank.19 Between 1990 and 2012, the number of projects cancelled or under stress in this region was approximately 2% of the total investment (12 cases).
In Sub-Saharan Africa, PPP investments grew by approximately 16% to US$12.8 billion in 2012, reaching 7% of the global investment. Between 1990 and 2012, 471 projects reached financial closure. The telecom sector constituted 77% of these investments. As in other part of the world, greenfield projects are the most common form of contracts. The number of projects cancelled or under stress in this region between 1990 and 2012 was approximately 5% of the total investment (50 cases).20