Variation between providers in the cost to eradicate the backlog maintenance
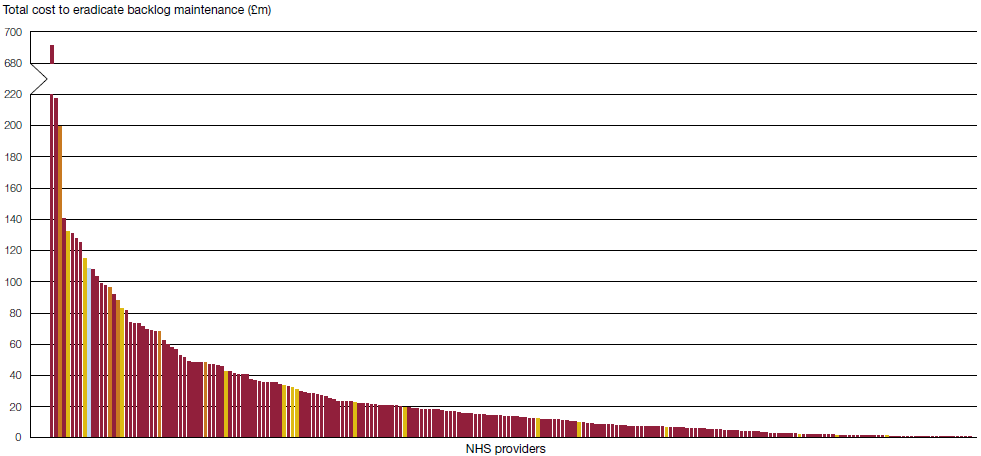
1.7 The cost to eradicate backlog maintenance varies between the 227 NHS providers reporting as at October 2019 (Figure 3). The top 20 NHS providers account for 45% of all backlog maintenance. These 20 providers are all acute hospitals, and 12 of them are also teaching hospitals.
1.8 An investment of £850 million over five years for new capital schemes was announced in August 2019 and are listed in Figure 15 in Appendix Two. Those NHS providers receiving assistance from the scheme have been highlighted in yellow and blue in Figure 3. There is no clear relationship between those NHS providers with high levels of backlog maintenance, and these new schemes announced.
• Those six NHS providers who will develop hospitals under the Health Infrastructure Plan (HIP1, 2020-2025) with £2.7 billion of funding are highlighted in orange and blue in Figure 3 and are listed in Figure 16 in Appendix Two. They range from the third to the 38th highest backlog maintenance.
• For the period 2025-2030, 21 NHS providers have been given £100 million of seed funding to develop hospitals under phase two (HIP2). The chosen NHS providers are listed in Figure 17 in Appendix Two, alongside their rank for backlog maintenance in 2018-19. The level of high- and significant-risk backlog maintenance was included as a criterion in selecting these 21 NHS providers.
| Figure 3 NHS providers receiving funds from the new capital scheme are distributed across all providersNotes1 |
|
|
|
|
| Notes 1 An investment of £850 million over five years for new capital schemes was announced in August 2019 and are listed in Figure 15 in Appendix Two. 2 The six NHS providers who will develop hospitals under the Health Infrastructure Plan (HIP1, 2020-2025) with £2.7 billion of funding are listed in Figure 16 in Appendix Two. 3 The y-axis is broken at £220 million to fit all NHS providers on the same figure. |
| Source: National Audit Office analysis of NHS Digital's Estates Return Information Collection (ERIC) data 2018-19 |


 Leeds Teaching Hospitals NHS Trust is receiving funding under both the August 2019 and September 2019 announcements
 All other
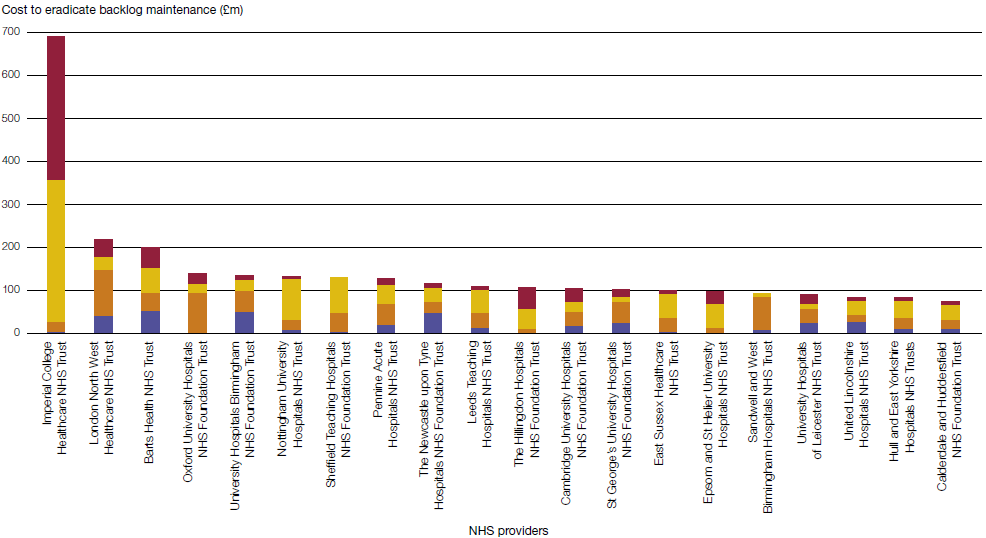
 1.9 The 20 NHS providers with the highest costs to eradicate backlog maintenance are shown in Figure 4. Imperial College Healthcare NHS Trust has £691 million total backlog maintenance, of which £334 million is high-risk and accounts for 31% of NHS high-risk backlog maintenance; this may be partially explained by the fact that a quarter of its buildings are more than 70 years old.
1.10 NHS providers are responsible for measuring their own costs of addressing backlog maintenance, but their reporting may not be accurate. In 2017 the Naylor Review set out to develop a new estates strategy and stated that it believed the backlog maintenance figure was a "substantial underestimate", because there has been no real incentive to report the situation accurately.2
| Figure 4 Imperial College Healthcare NHS Trust has around £700 million of backlog maintenance |
|
|
|
|
| Source: National Audit Office analysis of NHS Digital's Estates Return Information Collection (ERIC) data 2018-19 |
 Low-risk backlog maintenance
____________________________________________
2 Sir Robert Naylor, NHS Property and Estates, 2017.