Reallocation of capital
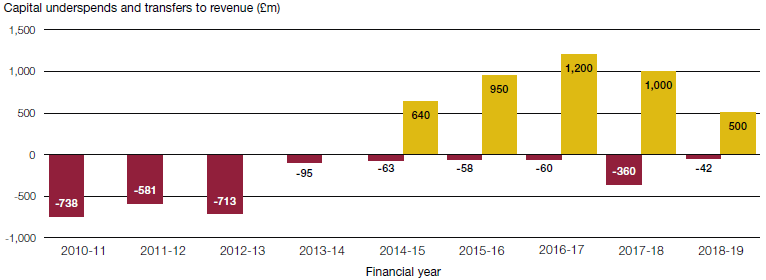
2.8 The Department began reallocating capital spending to revenue spending in 2014-15. It transferred £640 million in 2014-15, £950 million in 2015-16, £1.2 billion in 2016-17, £1 billion in 2017-18 and £500 million in 2018-19 (Figure 8). Since 2014-15, the Department has transferred in total £4.3 billion from capital spending to revenue spending. The Department plans to transfer £0.5 billion in 2019-20.
2.9 HM Treasury guidance clearly states, "Departments may not switch provision from capital budgets to resource budgets; such switches would mean that money that had been earmarked for investment was used for current spending". The £640 million transferred in 2014-15 and the £950 million transferred in 2015-16 were agreed in-year through the Supplementary Estimates process.3 The 2015-16 transfer of £950 million followed a November 2015 Spending Review announcement of £4.8 billion of capital investment every year from 2015-16 to 2020-21. Three months later, in February 2016's Supplementary Estimate, the £950 million was transferred and £3.7 billion was available for capital for 2015-16. In February 2016, HM Treasury gave its approval for special flexibility to allow the Department to make multi-year transfers from capital to revenue spending, up to a maximum amount in each year between 2016-17 and 2019-20. The Department has used all of this flexibility. In 2019-20, the Department plans to transfer £471 million, although this will exceed the agreed special flexibility for that year by £221 million. This process of switching from capital to revenue budgets is not unique to the Department of Health & Social Care.
| Figure 8 Large transfers from capital spending to revenue spending occurred between 2014-15 and 2018-19 |
|
|
|
|
| Source: National Audit Office analysis of Department of Health and Department of Health & Social Care Annual Report and Accounts, 2014-15 to 2018-19 |
 Capital underspends against
 Capital to revenue transfers
2.10 The actual amounts spent by the Department and NHS providers on capital in each year up to and including 2018-19 is shown in Figure 9 overleaf. The 2019-20 column shows the estimated limit for capital spending by NHS providers in 2019-20 together with the Department's total capital limit and planned transfer of resources from the capital budget into revenue. Transfers from capital to revenue are expressed at a Departmental level and other outturn refers to capital spending in other parts of the Departmental group (see Figure 6).
| Figure 9 The Department began transferring from its capital budget to its revenue budget in 2014-15 | ||||||||||
| 2010 -11 | 2011-12 | 2012-13 | 2013-14 | 2014-15 | 2015-16 | 2016-17 | 2017-18 | 2018-19 | 2019-201 | |
| Total Department of Health & Social Care capital outturn | 4,202 | 3,786 | 3,783 | 4,349 | 3,951 | 3,632 | 4,556 | 5,238 | 5,941 | 7,020 |
| Of which: | ||||||||||
| 1,024 | 1,100 | 1,100 | Note 1 | |||||||
| Other outturn | 742 | 922 | 619 | 1,118 | 644 | 690 | 667 | 1,092 | 913 | Note 1 |
| NHS providers' outturn | 3,460 | 2,864 | 3,164 | 3,231 | 3,307 | 2,942 | 2,865 | 3,046 | 3,928 | 4,800 |
| Total capital to revenue transfers | 0 | 0 | 0 | 0 | 640 | 950 | 1,200 | 1,000 | 500 | 471 |
| Notes 1 2010-11 to 2018-19 are outturns. 2019-20 are estimated limits and the planned capital to revenue transfer provided by the Department. 2 R&D outturn is included as it has scored, and will continue to score, as capital expenditure from 2016-17 onwards due to a classification change under European System of Accounts 10 moving Research and Development to Capital DEL (CDEL). | ||||||||||
| Sources: Figures from 2010-11 to 2018-19 are those reported in and for each year's corresponding Department of Health; and from 2017-18, Department of Health & Social Care, Annual Report and Accounts, 2010-11 to 2018-19. The 2019-20 planned NHS provider limit, total CDEL estimate and 2019-20 planned capital to revenue transfer are estimates provided to the National Audit Office by the Department | ||||||||||
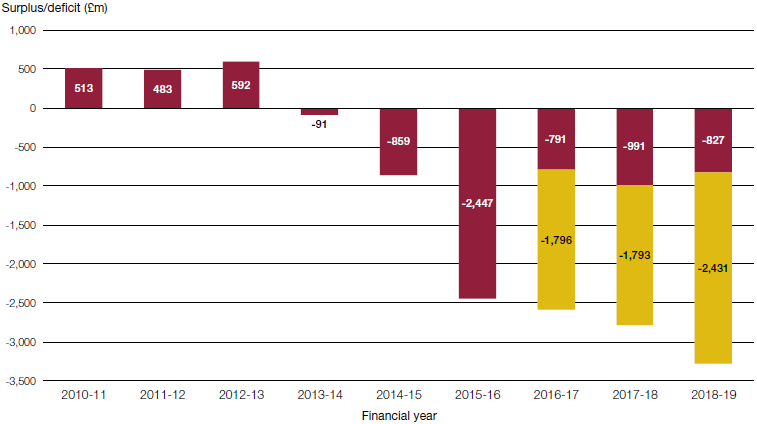
2.11 The transfers from capital to revenue spending occurred at a time when the financial position of some NHS providers was deteriorating (Figure 10). The Department was thus able to prioritise support for day-to-day spending on current services at the cost of foregoing longer-term investment in buildings and other long-term assets. This increases the risk that assets deteriorate, and that future capital spending is needed to bring assets back up to an adequate standard, rather than making investments in new technology or premises. The Committee of Public Accounts (the Committee) said in March 2018, "despite our earlier warnings, the Department has not yet assessed the impact on patient services of repeatedly raiding its capital budget to fund short-term needs of the NHS".4 In March 2019, the Committee found that the Department was again unable to give a measure of the impact on healthcare services from these transfers.5 The Department acknowledges that transferring money from capital to revenue spending is not an ideal solution but judged it to be in the best interests of patients while the NHS got to grips with its financial problems.
| Figure 10 From 2013-14 NHS providers have been in overall deficit even with the help of the Sustainability and Transformation Fund and the Provider Sustainability Fund (from 2018-19) |
|
|
|
|
| Notes 1 In April 2016, the Sustainability and Transformation Fund was introduced to support the financial recovery of NHS trusts. It originally committed funding of £1.8 billion each year until 2018-19, but in February 2018, NHS England and NHS Improvement committed an additional £650 million to the fund to create a larger £2.45 billion Provider Sustainability Fund for 2018-19. The graph highlights that the deficits reported from 2016-17 would have been greater but for this STF/PSF funding. 2 The figure for 2018-19 excludes adjustments due to the accounting treatment of Carillion's Private Finance Initiative assets. |
| Source: Comptroller and Auditor General, HM Treasury, NHS financial sustainability, Session 2017-2019, HC 1867, National Audit Office, January 2019. Updated with 2018-19 NHS trusts and NHS foundation trusts accounts information |
2.12 Any delay in the approval of capital projects creates a risk that the overall national budget is not fully spent. NHS providers told us that when central funding decision announcements were delayed, this reduced the time they had to implement their capital plans for that year. Unused capital money, whether from central funding or internally generated by NHS providers (see paragraph 3.2), cannot be easily redistributed within the NHS. Capital budgets have not been fully utilised in each of the financial years between 2010-11 and 2018-19 (Figure 8). Between 2010-11 and 2012-13 there was an average underspend of £677 million (12%) in capital spending. In 2017-18 the capital underspend was £360 million (6%), and the total capital underspend since 2010-11 is £2.7 billion. This cumulative underspend has occurred at a time when the UK has had lower levels of medical equipment (for example, 26th out of the EU28 countries for magnetic resonance imaging (MRI) and 27th out of the EU28 for computed tomography (CT) scanners per population)6 and there was growing signifcant- and high-risk backlog maintenance (paragraphs 1.4 to 1.9).
________________________________________________________________________
3 Supplementary estimates are the means of obtaining from Parliament the legal authority to consume resources. HM Treasury, Central Government Supply Estimates 2015-16, Supplementary Estimates, HC 747, February 2016.
4 HC Committee of Public Accounts, Sustainability and transformation in the NHS, Twenty-ninth Report of Session 2017-2019, HC 793, March 2018.
5 HC Committee of Public Accounts, NHS financial sustainability, Ninety-first Report of Session 2017-2019, HC 1867, March 2019.
6 Organisation for Economic Co-operation and Development, Health at a Glance Europe 2016, figures 7.17 and 7.18 (2014 or nearest year). Figures are for the United Kingdom, for which they are an estimate and only include scanners in the public sector.