Analysis of workshop and survey responses
The survey results are based on responses from specialist project managers and executive service provider managers. 37 responses were received for the pre-workshop survey and 21 responses from the post-workshop survey. Workshops were conducted in Sydney, Brisbane, Melbourne and Auckland from June to August 2019. One workshop with contract managers and a second workshop were held with service providers representative in each jurisdiction. 11 contract managers attended the workshops and 28 service providers participated in the workshops. Detailed workshop results are provided in Appendix E and the combined satisfaction scores of survey and workshop participants are compared against the projects in Figures D.6 and D.7 below.
Analysis of workshop and survey responses provided an overall level of satisfaction with the PPP project and this was compared to the ratio of the contract price versus the government's PSC (original estimate). This comparison is provided in Figure D.6. Most perceived satisfaction scores for the projects were very good to excellent and all results were well above satisfactory. There is a tendency for an increasing level of satisfaction as the relative payment to PPP Co increases. Given that there is no evidence of PPP Co increasing its pricing over the contracted amounts, this tendency indicates that the companies are managing within their budgets.
Figure D.6: Overall satisfaction compared to the ratio of the contract price vs the government's PSC (original estimate)
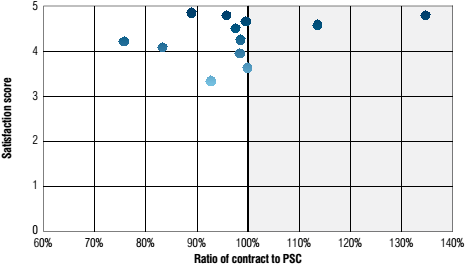
Figure D.7 compares the satisfaction score, computed by averaging the satisfaction scores recorded in the survey with those stated by participants in the workshops, over the years the PPP project was in operation. A satisfaction score of five indicates the users considered excellent outcomes were being achieved, a score of one indicates poor outcomes were being achieved. A score of three indicates that on balance an acceptable outcome was being achieved.
Figure D.7: Project satisfaction versus years in service
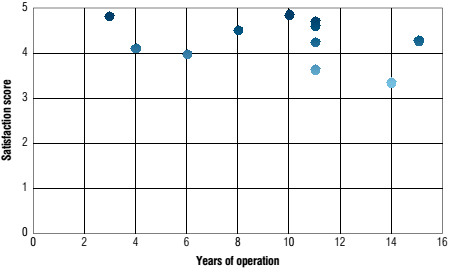
The satisfaction levels shown in Figure D.7 indicate that service providers are very satisfied with all PPP contracts with the majority rating four or greater. This leads to the conclusion that users consider the services being received to be of very high to excellent level.
The level of satisfaction of the service over time was tested in the workshops. Workshop user representative participants initially indicated they had little or no specific understanding of the PPP contract and thus early comments received tended to be related to any areas of frustration or desires for improvement they may have. As the sessions unfolded users started to understand the services provided by PPP Project Co and those matters and decisions that remained in the hands of government. The users then tempered their initial comments (focusing on frustrations) when they reflected on their overall experience with the quality of their PPP facilities and services compared to traditional procurement (something that was not at the fore of their thinking). This reflection lead to a more positive satisfaction score being expressed in the workshops compared to surveys.
There is also a high likelihood that some of the reduced level of satisfaction over time may in fact be attributable to the well-known social psychological phenonium 'Recency Effect'. This is the effect of more recent events being better remembered when forming a judgement than former events. Conformation of this would require further investigation.