Equivalisation
A3.15 Where distributional effects are quantified by applying weights, it may also be necessary to apply "equivalisation" techniques. Often the distributional impact of policy will be estimated by household, however households can have different structures.
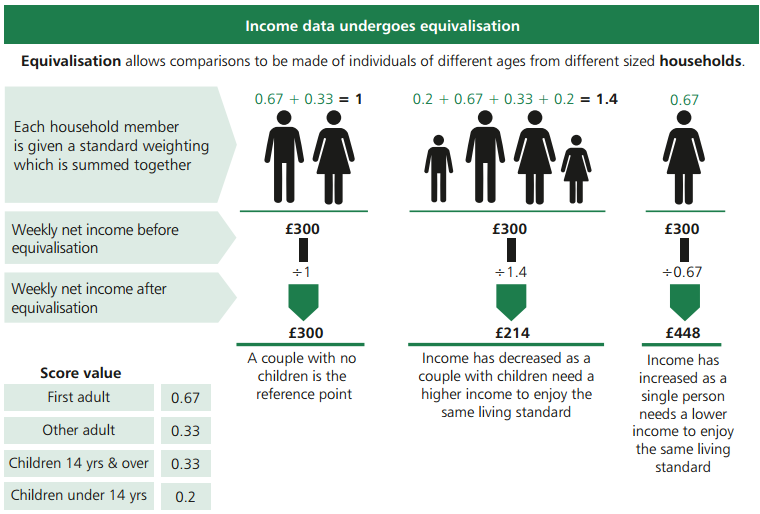
A3.16 Equivalisation applies a scaling factor to household income to adjust for composition (factors such as age, income and size) to standardise the welfare impact. This allows a consistent comparison in welfare terms between households of different structures. For example, where a single person would have a higher standard of living than a couple with the same household income, equivalisation produces a higher "equivalised income" for the single person to reflect this.
A3.17 An example of equivalisation is set out in Figure 7, which DWP use in the annual statistical publication on poverty at the UK level, entitled Households Below Average Income (HBAI). The government commonly bases analyses on the household as this is the level at which budgeting decisions and benefit incomes are considered. In some circumstances, however, it may be appropriate to consider relative incomes at an individual level.
Figure 7. Methodology for Income Equivalisation
A3.18 If specific data is not available for an intervention's target population, then data on incomes by quintile may be used. This is provided by the ONS and HBAI and summarised in Table 6 below. HBAI (2017) presents weekly equivalised income (£) by quintile in 2015/16 prices and is updated annually. Ensuring this is representative of the income for the group concerned in a particular proposal is important and affects the accuracy of any estimates produced.
Table 6. Quintile Groups of all Households Ranked by Equivalised Disposable Income (Based on Weekly Income Before Housing Costs 2015/16)
| Bottom | 2nd | 3rd (Median) | 4th | Top | Mean of All Households |
Final income (£) | 244 | 363 | 481 | 638 | 946 | 593 |