2.3 A few projects cause a lot of trouble
The problem of cost overruns is concentrated. It's not a case of small amounts adding up across the 33 per cent of projects that have an overrun. Instead, more than 80 per cent of total cost overruns were caused by the 14 per cent of projects that exceeded their initial cost by more than 50 per cent (Figure 2.2 on the following page).70
More than one third of the aggregate cost overrun since 2001 came from just seven of the projects with the highest final costs (Table 2.1 on the next page).
Figure 2.1: Bigger projects overrun more often and by more
Frequency of overruns and average increase in cost as a percentage of initial project costs by level of initial cost
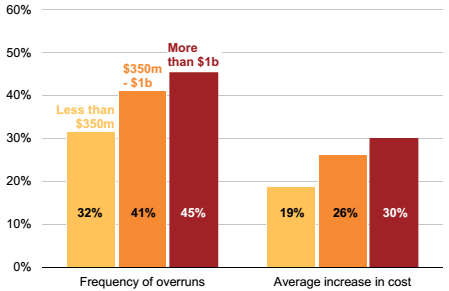
Note: Includes all public road and rail projects costing more than $20 million that were completed between Q1 2001 and Q1 2020.
Source: Grattan analysis of Deloitte Access Economics Investment Monitor.
Table 2.1: Seven of the largest projects completed in the past two decades accounted for more than one third of overruns
Project | Year completed | Final cost ($2020b) | Overrun ($2020b) |
Sydney Metro Northwest | 2019 | 7.9 | 0.7 |
Clem Jones Tunnel (Brisbane) | 2010 | 4.2 | 3.1 |
Airport Link (Brisbane) | 2012 | 4.2 | 2.7 |
Eastlink (Melbourne) | 2008 | 3.6 | 1.7 |
Epping to Chatswood Rail Link (Sydney) | 2008 | 3.6 | 2.0 |
CBD and South East Light Rail (Sydney) | 2019 | 3.3 | 1.6 |
New MetroRail (Perth) | 2007 | 2.7 | 0.8 |
Note: Costs inflated to Q1 2020 from the mid-point of each project's construction period using ABS producer price index for road and bridge construction.
Sources: Grattan analysis of Deloitte Access Economics Investment Monitor, AECOM (2020), Brisbane City Council (2004, p. 2), SGS Economics & Planning (2019, p. 35), Queensland Government and Brisbane City Council (2005, p. 2), Bligh (2008), Audit Office of New South Wales (2020, p. 1), W/A Government (2001, p. 917), and W/A Government (2002, p. 892).
The overruns on the largest projects are often the size of a large project. For the $1 billion-plus projects that had an overrun, the average increase in cost was more than $1 billion (Figure 2.3 on the following page). Almost half of the projects with an initial price tag of more than $1 billion in today's money had an overrun (Figure 2.1 on the previous page).
The portfolio now under construction includes many mega megapro-jects, valued at more than $5 billion, and the recent history of high overruns on the largest projects suggests there are storms ahead.
The next chapter focuses on the other key predictor of cost overruns - premature announcements.
Figure 2.2: Large cost overruns are infrequent, but expensive
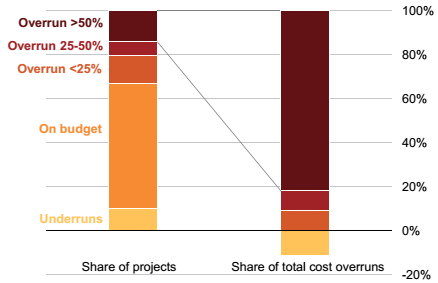
Note: Includes all public road and rail projects costing more than $20 million that were completed between Q1 2001 and Q1 2020.
Source: Grattan analysis of Deloitte Access Economics Investment Monitor.
Figure 2.3: When a large project has an overrun, it's likely to be large
Cost overrun, for projects that had an overrun, $2020 billion
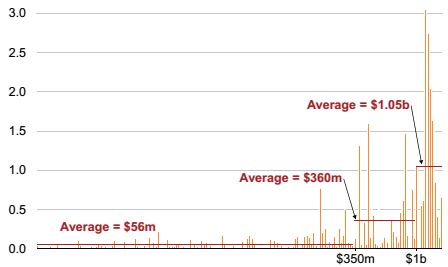
Projects ordered by initial cost ($2020), smallest to largest
Note: Includes public road and rail projects costing more than $20 million that were completed between Q1 2001 and Q1 2020 and that had an overrun.
Source: Grattan analysis of Deloitte Access Economics Investment Monitor.
____________________________________________________________________________
70. These projects resulted in a total of $31 billion in overruns. This is about 82 per cent of the $38 billion of total cost overruns. (The aggregate cost overrun of $34 billion is total cost overruns minus total cost underruns.)