6.3.1 Take advantage of cyclical conditions
While the number and size of cost overruns well and truly eclipses the number and size of cost underruns, the six largest underruns since the beginning of 2001 all occurred on projects completed since the beginning of 2015. In that period, 12 per cent of projects finished below their first announced cost, compared to 9 per cent in the 14 years before.
Similarly, cost overruns were less frequent and smaller on average in the period from 2015 to 2018 than the long-term averages - although the trend was not sustained into 2019.
This potentially promising trend to smaller overruns and more underruns appears, at least in part, to have resulted from favourable cyclical conditions. According to the International Monetary Fund, individual projects can cost 10-to-15 per cent more simply because they are built at a time of particularly high public investment.160
The period of fewer and smaller overruns since 2015 may have reflected an unexpected flattening in costs in the preceding years (Figure 6.3 on the next page). Initial cost estimates would have assumed that recently-observed growth in prices in the construction market would continue in the near future. If that growth did not eventuate, and prices flattened, bids for tenders may have come in lower than expected, leading to projects contracted or constructed at lower-than-expected costs between late 2013 and late 2016. And a number of these projects would have been completed from about 2015 onwards.
These market conditions probably also led to a period of more frequent and larger underruns.
A major factor in this increase in underruns appears to have been conditions in the construction market as the mining boom wound down. In late 2014, it was reported that 'the cost of building projects has fallen by up to 50 per cent as construction firms desperately seek work after the end of the mining boom'.161 The then Minister for Infrastructure and Regional Development, Warren Truss, was quoted as saying:162
What we have found is that when we have been calling tenders for projects over the last 12 months or so, we are getting prices sometimes as low as half the cost that we were being asked to pay three or four years ago, or maybe two or three years ago.. .Almost universally now tenders are coming in under our estimates, and projects are being completed under our estimates.
These conditions were still prevailing almost two years later, when BIS Shrapnel reported that its monitoring of major projects was revealing 'more projects where the winning bid is much lower than what was initially budgeted (and expected) by governments'.163 The BIS Shrapnel report noted the example of the Cooroy to Curra: Section C project on the Bruce Highway. Originally estimated to cost $624 million, it was contracted in February 2016 for $384 million.164
Figure 6.3: Transport construction costs were broadly flat between late 2013 and late 2016
Producer Price Index, road and bridge construction, Australia
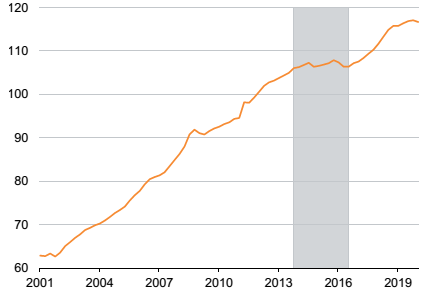
Source: Index Number 3101 from Table 17 of ABS (2020c).
Another Queensland project contracted around the same time, Stage 2 of the Gold Coast Light Rail, had a similar experience. The total cost of the project had been reported as $700 million in December 2015.165 But when the contracts were awarded in March 2016, the cost had dropped to $420 million.166
We'd expect prices in a market to fall as demand does. But even in the specific example of the market for infrastructure construction, where prices reflect - among other things - the risk that something might be more costly to build than expected, contractors are willing to take on a given level of risk for a lower price if there is less work around.167
The implication of this finding on more and larger cost underruns, along with fewer and smaller cost overruns, is that there are potentially material value-for-money gains if governments take care and a medium-term view on the timing and rate at which they introduce new projects to the market. This indicative finding warrants more detailed analysis by governments.
____________________________________________________________________________
160. IMF (2020, p. 37).
161. Freed (2014).
162. Ibid.
163. Hart (2016).
164. Rostron (2016a).
165. ABC News (2015).
166. Rostron (2016b).
167. Battley (2020).