Appendix B: Risk appendix
The cost estimation handbooks that are current today generally recommend some combination of four tools: expected value, sensitivity analysis, probability pricing, and reference class forecasting, often referred to as benchmarking or validation.
The first three tools involve the estimation of particular statistics, or characteristics of the distribution of potential costs. Reference class forecasting is a method for estimating the overall distribution.
The expected value of a project's cost is the average or mean cost of a project. It is calculated by assigning a single probability to each potential cost outcome, and multiplying this probability by the cost of that particular outcome if it did occur. This is the simplest approach to estimating the likely size of cost overruns. Its main shortcoming is that it does not include the costs of any unknown risks not explicitly identified by the estimator.
Sensitivity analysis assesses the range within which a cost estimate is likely to vary. It involves specifying the range of values that critical inputs to project cost estimates could take, and estimating how much the project would cost if the inputs were to take these values. Like the expected value methodology, it does not deal with unknown risks not explicitly identified by the estimator.
Probability pricing identifies how large a project budget needs to be to accommodate a specific probability that the project will be completed within budget. For instance, most projects have 'P50' (or median) and 'P90' (or 'worst case') cost estimates, which identify the prices for which it is expected that a project will meet or better its budget in 50 per cent or 90 per cent of cases respectively.
Figure B.1: Key risk measurement and management concepts
Illustrative probability distribution of cost outcomes on individual projects
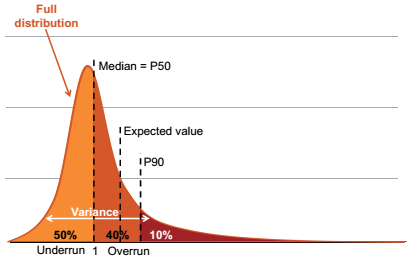
Notes: The distribution of cost risk depicted is a stylized representation of the distribution of cost overruns. This chart illustrates the relative distances between key points of the distribution.
Reference class forecasting, often referred to as benchmarking or validation, compares cost estimates for one project to those on similar projects that have already been built. The average size of cost overruns observed across the sample can be used as an estimate of the expected value of cost overruns; the variance of the outcomes on the comparison projects can be used to understand the range within which a cost estimate is likely to vary; and the different points within the observed distribution can be used to estimate probability prices.
Reference class forecasting incorporates the likely costs of unknown risks and does not suffer from optimism bias, because it relies on objective historical information. Its main shortcoming is that it does not account for the ways in which a project's risk profile is unique.
Figure B.1 on the preceding page illustrates these tools for the costs of a group of completed projects: expected value (or mean); variance (assessed by sensitivity analysis); and probability pricing levels. The fourth tool, reference class forecasting, offers a way to improve the quality of expected value, sensitivity analysis, and probability pricing by relying on experience.