Consumption, Cost & Benchmark Performance6
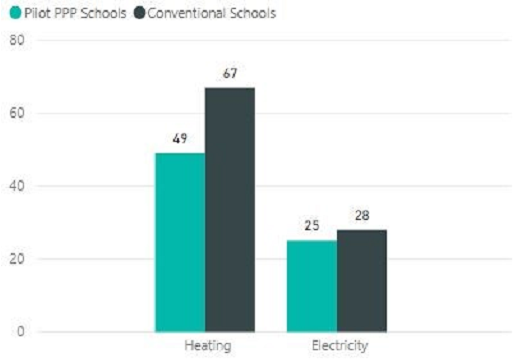
2.53 The average electricity consumption for the Pilot PPP Schools Bundle is a 10.7% less than that at the Conventional Schools, 25 kWh/m2 versus 28 kWh/m2 to date.
2.54 The average heating consumption for the Pilot PPP Schools Bundle is a significant 26.9% less than that at the Conventional Schools, 49 kWh/2 versus 67 kWh/m2 to date.
Figure 2.16 - Heating and Electricity Consumption (kWh/m2)
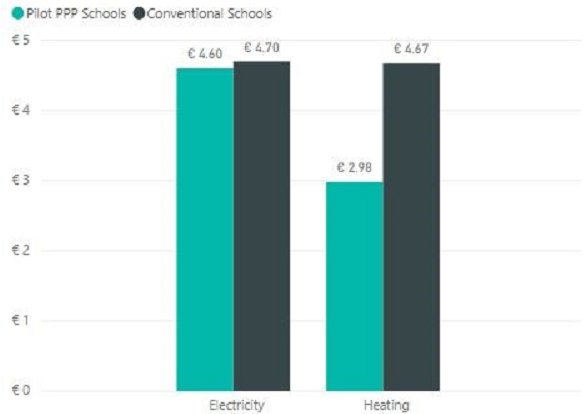
2.55 The overall costs of energy (electricity and heating, €/m2) are also lower at the Pilot PPP Schools when compared to the Conventional Schools. Whilst the Pilot PPP Schools show a slightly lower unit rate for electricity (€4.6/m2 versus 4.7), it is significantly less for heating (€2.98/m2 versus €4.67/m2) (Figure 2.17). This is largely because the Pilot PPP Schools use natural gas and LPG for heating, whereas the Conventional Schools utilise a mix of natural gas and oil. Centralised procurement of the energy may also result in a reduced energy cost and consumption is likely to be reduced due to provision of energy saving elements, such as a central BMS system and additional controls on services equipment.
Figure 2.17 - Heating and Electricity Costs (€/m2)7
2.56 When compared with industry benchmarks8 for energy data and against electricity benchmarks, the Pilot PPP Schools outperform the Conventional Schools. All five Pilot PPP Schools perform to typical practice benchmark, with two achieving good practice. In comparison, four Conventional Schools perform to typical practice benchmark, with none achieving good practice. Against heating (gas and oil) benchmarks, all Pilot PPP Schools and all Conventional Schools are performing to good practice fossil fuel benchmarks; note that this should be considered in the context of the heating consumption outcomes above.
__________________________________________________________________________________
6 Based on 2018 data (the most recent full years' data available).
7 Nominal costs for the year of analysis, NPV costs estimated for the whole concession are considered in the Financial Analysis.
8 CIBSE Guide F 2012 Table 20.1 Fossil and electric building benchmarks for secondary schools.