Analysis of Reviewed Projects
The 52 projects subject to an EHC represent 9% of the 551 projects in the portfolio and nearly 70% of projects expiring before the end of 2027. These percentages are similar if the analysis is based on capital expenditure or unitary payment rather than number of contracts.
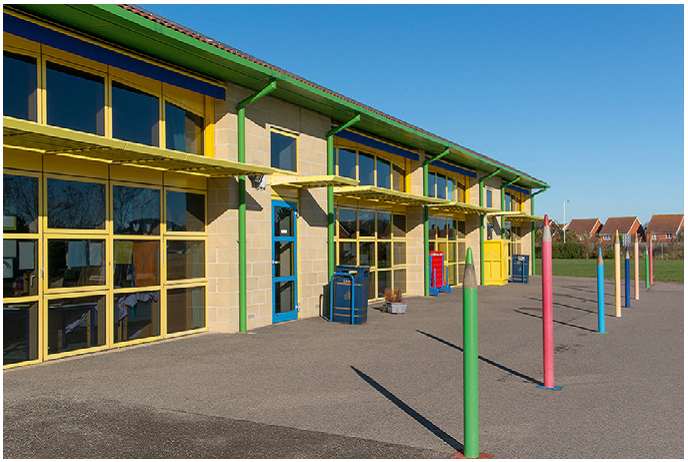
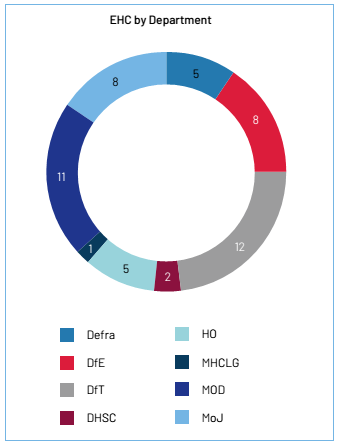
The 52 projects are not fully representative of the departmental mix, with 49 of the projects from 6 of the 14 PFI sponsoring departments. In particular, utilisation of PFI was adopted later, but extensively, by the health and education departments for hospitals and schools. Whilst the 52 projects are not fully representative of the whole portfolio it is anticipated that the general themes will have been captured in this analysis, though further sector specific themes may arise. |
|
Department | % of Portfolio | % of EHC | Variance | |
DCMS | 3.1% | 0.0% |
|
|
Defra | 4.5% | 9.6% |
|
|
DfE | 31.4% | 15.4% |
|
|
DfT | 10.2% | 23.1% |
|
|
DHSC | 22.5% | 3.8% |
|
|
DWP | 0.4% | 0.0% |
|
|
FCDO | 0.2% | 0.0% |
|
|
HMRC | 0.5% | 0.0% |
|
|
HMT | 0.2% | 0.0% |
|
|
HO | 6.9% | 9.6% |
|
|
MHCLG | 10.3% | 1.9% |
|
|
MOD | 6.2% | 21.2% |
|
|
MoJ | 3.4% | 15.4% |
|
|
SIA | 0.2% | 0.0% |
|
|


Around 80% of projects are managed by local authorities. The reviewed projects are evenly split between those managed by central government departments and local authorities. The centrally managed projects are concentrated in the Ministry of Defence, Department for Transport and Ministry of Justice (prisons).
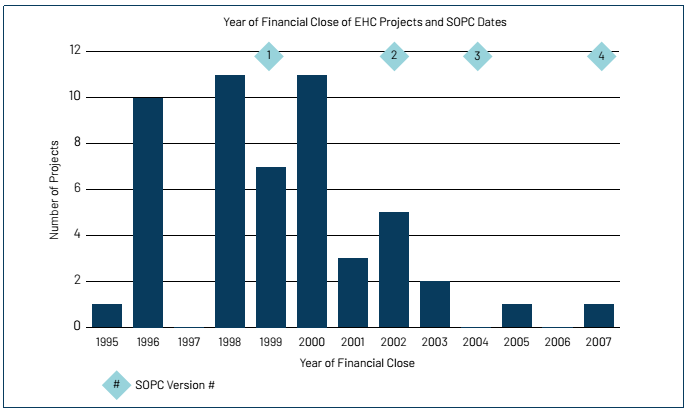
It is also likely that many of the projects reviewed will not have benefited from the Standardisation of PFI Contracts (SoPC). As such, there is likely to be greater risk inherent in these contracts when compared to later contracts benefiting from standardised terms. The chart below compares the financial close data to the SoPC version publication dates.
Department | Centre | LA | Total |
Defra | 0 | 5 | 5 |
DfE | 0 | 8 | 8 |
DfT | 9 | 3 | 12 |
DHSC | 0 | 2 | 2 |
HO | 0 | 5 | 5 |
MHCLG | 0 | 1 | 1 |
MOD | 11 | 0 | 11 |
MoJ | 6 | 2 | 8 |
Total | 26 | 26 | 52 |